


If you are an ArcGIS Online user, you have likely heard of Arcade. This relatively new language can be used for analysis in web maps or to enhance pop-ups and symbology. While it may seem like an intimidating new coding language, it is relatively simple to use and does not require any previous coding knowledge.
Our team recently worked on a few projects that allowed us to utilize Arcade to run calculations and create more intuitive pop-ups based on the data being mapped. Below, I will discuss a couple of these projects and share examples of our results.
Symbology
As humans, we rely heavily on colors when it comes to recognizing and connecting the things around us, whether physical objects or digital features. It makes it easier to tie information together and fully understand what we are looking at. When someone uses a map regularly and becomes familiar with the symbology of certain features, seeing something of the same color immediately makes us assume that those two things are related in some way. Before Arcade hit the scene, it was possible to change the color of the text in pop-ups, but it was a static configuration.
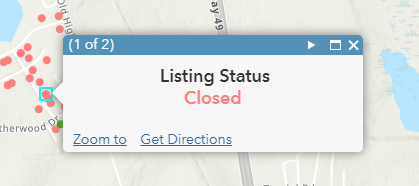
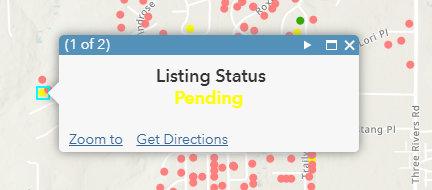
Thanks to Arcade, text color can now be dynamic based on specific attributes. For example, if a layer contains a “status” field, you can write expressions that will display the feature’s status, with font color varying based on the value of the attribute. Esri has several blog posts that walk you through using Arcade to do just that. Here is one I referenced when first getting started. You may notice in the example that two expressions are being used. The second is “Pop-up Color – Hex Values”, which works in conjunction with the first expression to change the text colors based on a value. In the first expression, you will list the values you want to display. The two we configured to enhance our pop-ups are shown below.


Once the first expression (Figure 1) is configured, the second (Figure 2) can be substituted for the HEX value in the pop-up’s HTML configuration window. Your pop-ups will then reflect the colors specified in your Arcade expressions. Below are a few examples of how they will look.

Absorption Rate Calculations
Arcade is frequently used to calculate values in layers that do not already contain certain attributes. For example, in real estate, the absorption rate of an area is an important piece of information, essentially telling us the strength of the market and whether it favors buyers or sellers. Using the Multiple Listing Service (MLS) data, we can create new pop-ups for the block group layer and Arcade will calculate absorption rates on the fly. This will also be added to the block group attribute table as a new field. While this can be done in ArcGIS Pro using the field calculator, it is much more streamlined to set the expression and forget it, especially given the dynamic nature of MLS data. (As opposed to manually recalculating the absorption rate every week as new MLS reports are generated, the points can simply be republished and Arcade will handle the rest.)
Here is a quick rundown of how we did this. The equation for absorption rate is: (# Active Listings / (# Listings Closed in the last 365 days / 12)). This means that within each block group, we need to count the number of total active listings and the number of listings that closed in the last year. Once the number of each listing type has been counted, the variables can be plugged into the equation and the absorption rate will be calculated on the fly. Below is the expression we created to calculate this value.

Arcade makes it much easier to keep frequently-updated data up-to-date in your web maps. If you want to enhance your pop-ups, symbology, or run more advanced analyses in your web maps, I highly recommend checking out Arcade. Its flexible nature makes it great for beginners and the results are pretty impressive! Want to implement Arcade into your web maps but not sure where to start? Connect with us at connect@geo-jobe.com to discuss how we can help!