

Photogrammetry is the art, science, and technology of obtaining reliable information about physical objects and the environment through processes of recording, measuring, and interpreting photographic images and patterns of recorded radiant electromagnetic energy and other phenomena (Wolf and Dewitt, 2000; McGlone, 2004).
How does Photogrammetry work?
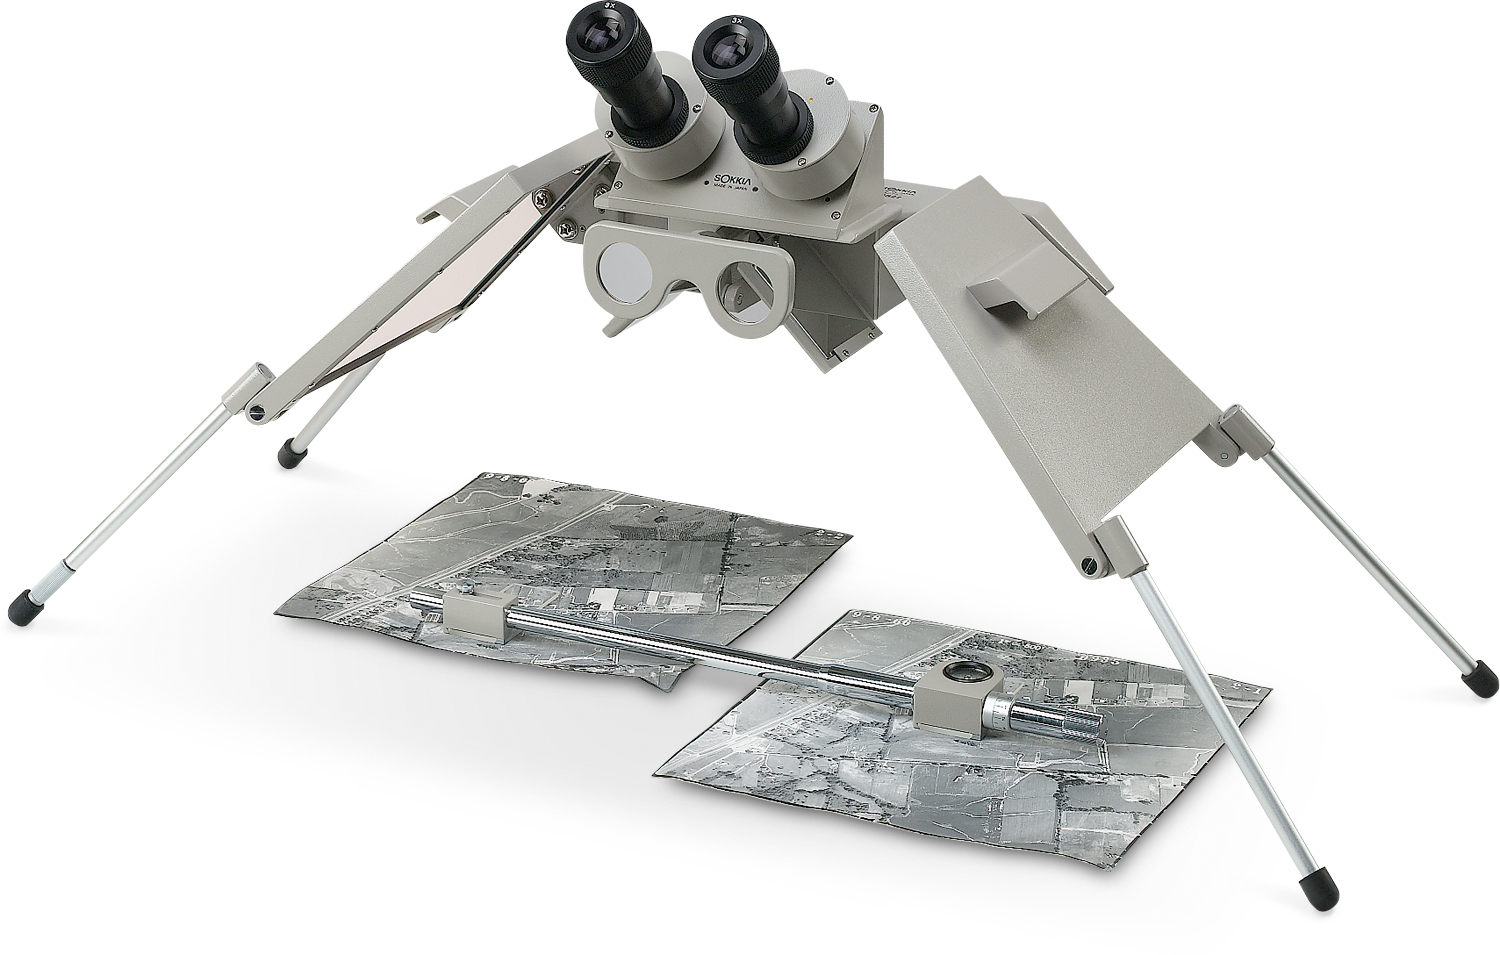
Triangulation is the basis on which all photogrammetry is accomplished, this principle has been in use for decades. Long before high-powered computers and advanced processing software were available, the military used stereoscopes to analyze stereoscopic image pairs. Stereoscopy works by capturing the same image at slightly different angles; these two-dimensional images are interpreted by the brain in a way that gives a perception of 3D depth. Triangulation is how depth perception works, your two eyes work together to judge distance.
While your brain can visualize depth, applying triangulation to stereoscopic image pairs, modern computers can rapidly record and model this information to produce accurate reproductions of reality.
Photogrammetry software exploits the principle of stereoscopy much in the same way that your brain does, only on a much larger scale. All we need is two images of the same feature taken at different angles to begin photogrammetric analysis. In the case of drone scans, we collect many hundreds if not thousands of images, all with slightly different viewsheds. This allows us to model, in three dimensions, anything that is visible from those photographs. In general, the more images we feed into our processing software, the more accurate the reproduction. Modern photogrammetry applications like Pix4D identify not just two images with similarities, but create a fabric of images woven together by using many photographs, matching ten or more images to a single observed point. This is compounded by matching the neighboring images and continuing that sequence across the entire study area. These “tie-points” can exist in many images, and oftentimes, there are millions of tie-points in a single project.

Because our state-of-the-art drones precisely record both timestamp and high accuracy GNSS positioning, we are able to create models that are accurate within inches. This location accuracy is critical when recreating surfaces that will be used as inputs for planning, design and modeling.
What is Photogrammetry Used For?
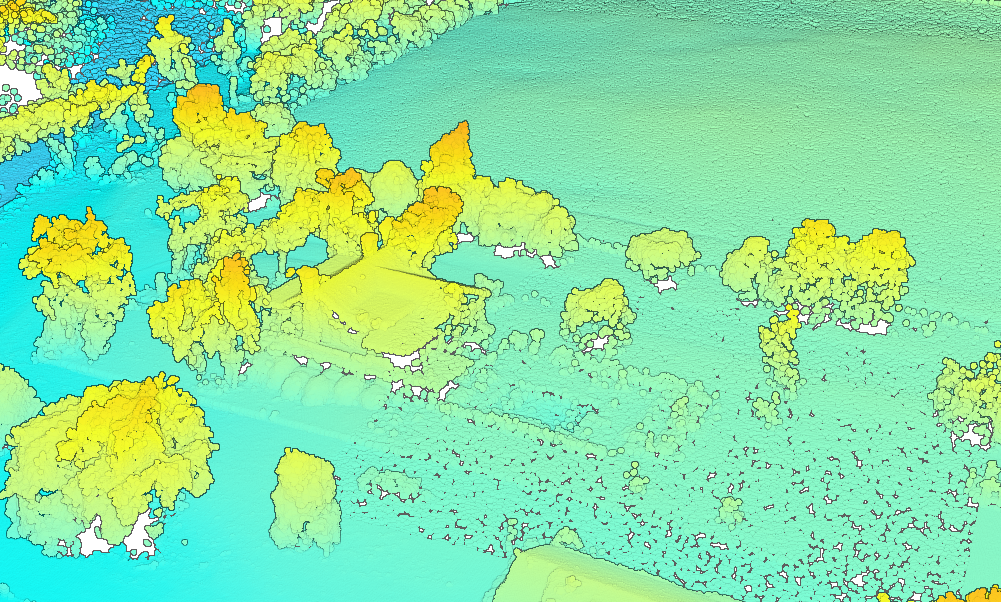
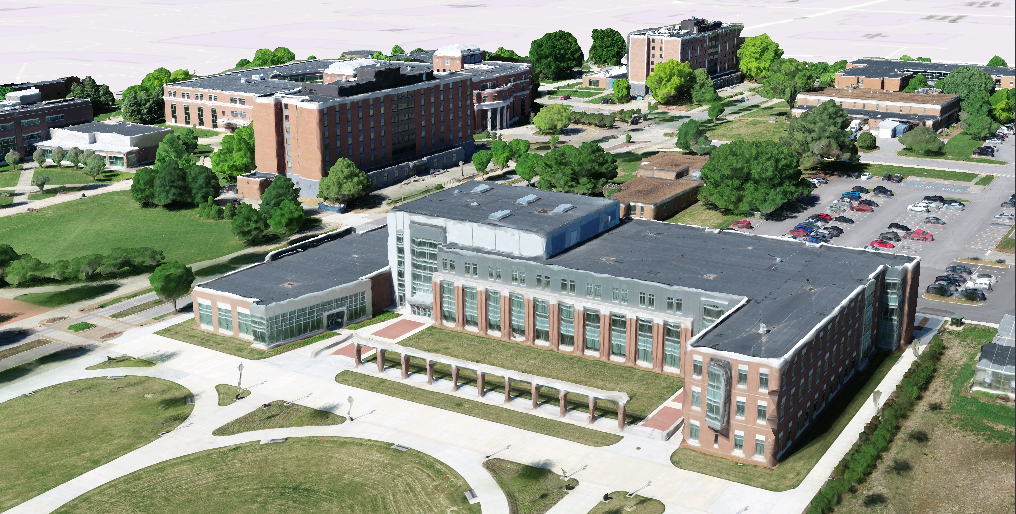
Our primary outputs are Orthomosaic imagery, surface reconstruction and 3D models. Orthomosaic imagery is a composite image produced from multiple input photographs that have been corrected for both distance and perspective. This mosaic represents an accurate plan view of the study area. Surface reconstruction can be in the form of digital surface, elevation or terrain models(DSM, DEM or DTM, respectively). These products are raster images where each pixel represents an elevation value. Elevation values are derived from the point cloud which is produced during photogrammetric processing. Point clouds are produced using triangulation. Each point that is present in at least two images is assigned an X, Y, Z position based on the triangulation algorithm’s results. This allows accurate reconstruction of the study area in 3D.
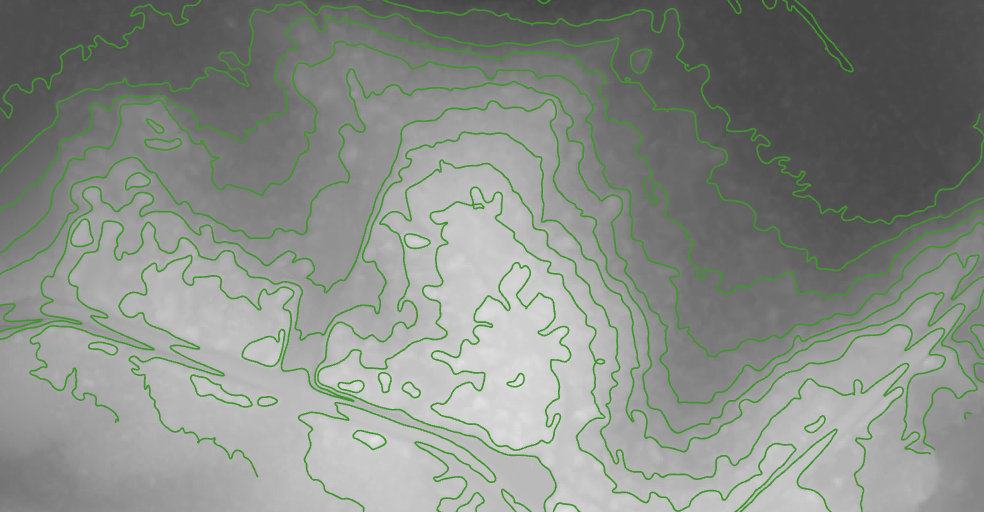
Engineers and planners use our data to create stormwater mitigation strategies, subdivision layouts and model reality in 3D. Having continuous surface data has a huge advantage over conventional transect surveying. Not only do we create accurate surfaces over the entire study area, but our scans produce data much faster than conventional methods. Many planners are accustomed to visualizing surfaces in the form of elevation contours. Using the information we gather during the creation of the DSM, we often produce surface contours that look more like a USGS quadrangle map.
These are just a few examples of how the GEO Jobe UAV team uses photogrammetry for digital mapping. Still, there are many other applications, including 3D modeling, which can be used to recreate any object that can be photographed.
Equipped with a basic understanding of photogrammetry, what other applications could you see this technology being used for? We’d love to hear your thoughts and ideas! Please contact us for a free hour consultation on how we can help you with your next project at connect@geo-jobe.com.