

If you missed Part 1, you can read that here.
Any modern browser you use to access the internet has something called “Developer Tools,” “The Developer Console,” or something similar. Collectively, these are commonly referred to as Dev Tools. Almost every web developer will leverage them, but how? In this article, we dive deeper into the Elements tab of the Dev Tools.
Note: For the purposes of this article, we will be using the Dev Tools in Google Chrome. If you are using a different browser, your Dev Tools may look slightly different.
The Elements Tab
The elements tab allows you to view and edit the HTML and CSS for the page that you’re on. If you access the Dev Tools by right clicking and then selecting Inspect, the tab will open with whatever element you right clicked on highlighted and all of its parent elements expanded. Other elements are collapsed by default, but can be expanded by clicking the arrows to their left. As you hover over elements in the inspector, they will be highlighted on the page, with colors representing the space the element takes up: blue for the element itself (as well as all parts of all of its child elements), green for padding, and orange for margins.
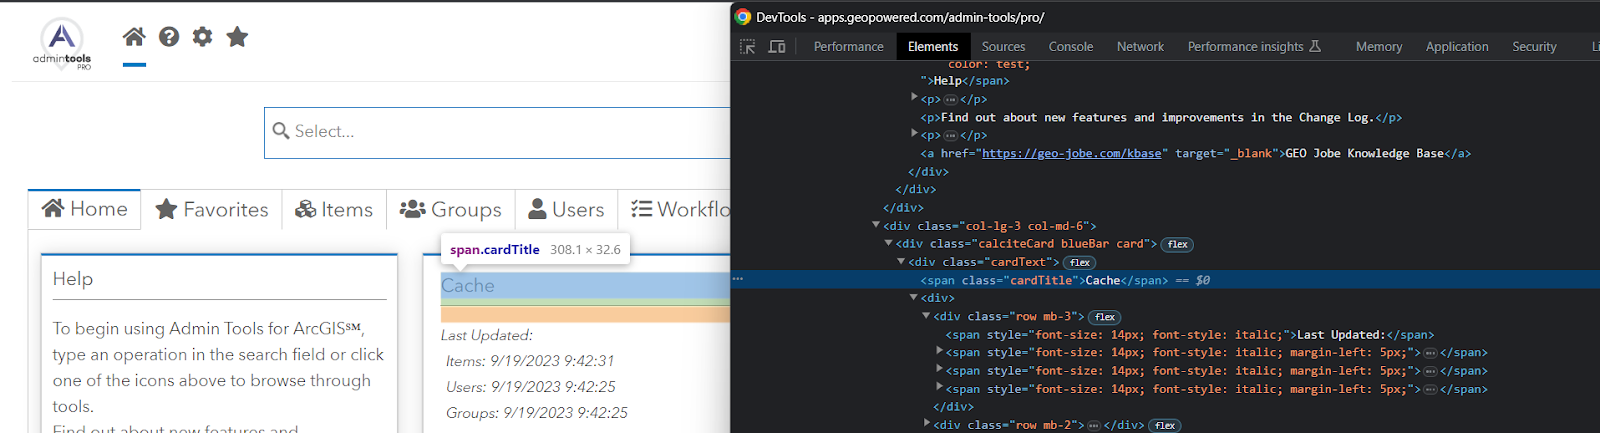
Hovering over an element in Admin Tools for ArcGIS. You can see the element itself (blue), its padding (green) and margins (orange), as well as its class, height and width in the popup above the element on the page.
You can also cause the inspector to open at a selected element by clicking the Select button in the upper left corner of the inspector, then clicking on the element you want to see. Directly to the right of the Select button is the Device Toolbar button, which displays the page as it would appear on various devices, such as mobile phones and tablets.
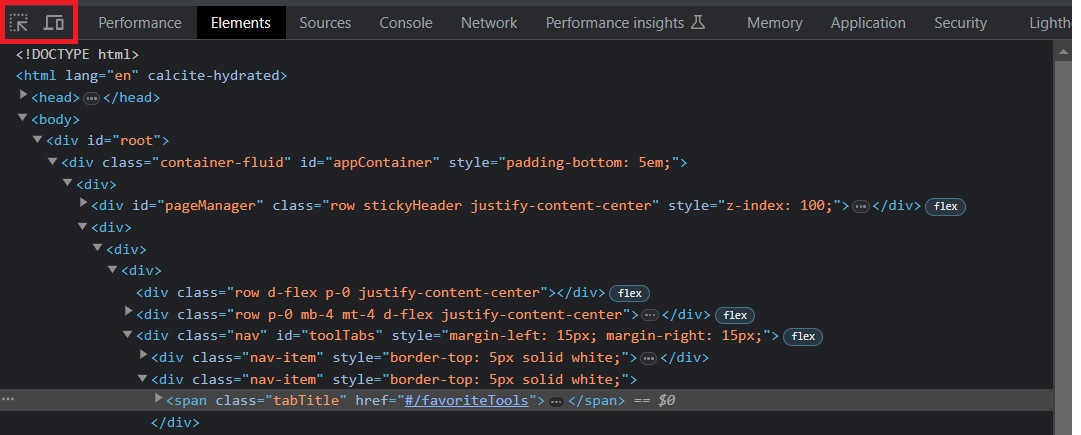
Additionally, you can use the Elements tab to test editing the HTML. If you right click on an element in the inspector and then choose Edit as HTML, you can edit the HTML text for that element (for example by changing a class name or changing a span to a paragraph). You can also perform a number of other actions, such as duplicating or deleting an element.
The effects of these changes will appear on the page, allowing you to see what would happen if you made a change. Keep in mind that this is only for testing purposes; changing things here doesn’t affect the actual code, and these changes will disappear if you navigate to a different part of the application or reload the page.
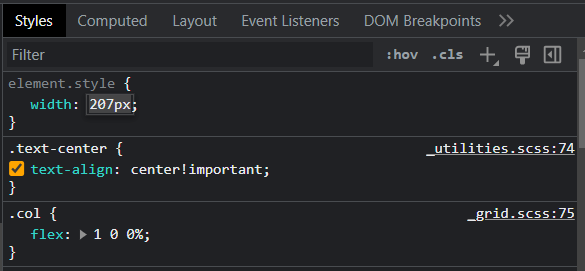
To the right of the HTML panel is the CSS panel. The CSS panel shows all of the CSS classes and properties that apply to a selected element, starting with the most specific at the top and showing broader classes as you go down. The element.style box at the very top shows only CSS that applies to that specific element. At any level, you can enable or disable CSS properties by checking or unchecking the box to the property’s left, and you can see the file and line number where the property is being set in the code to the right of the property (provided the code isn’t obfuscated).
You can also test out CSS properties by clicking inside the box and then typing in the property and its value, or by altering a property’s existing value by clicking on it. Like editing the HTML, making changes to the CSS in the inspector is only for testing purposes and won’t actually change the underlying code, but it provides a good way to test a number of possibilities quickly.
Say you want to figure out how wide a div should be. You think 200px might be good, but you’re not sure. Rather than putting values in your code and then needing to reload the page each time you test a value, you can highlight the element in the inspector and then type in width: 200px in the element.style section. If that turns out to be too small, rather than typing in new values, you can click on the 200px, then press and hold the up arrow on your keyboard. This will cause the width to increase 1px at a time, and you can watch the div grow on the page until it hits the perfect width.
You can then apply that width to your code. You can also use the up and down arrows to scroll through choices for CSS properties that have a defined set of values, such as position. As you scroll, the effects of each value will also be visible on the page, allowing you to quickly see which value is best.
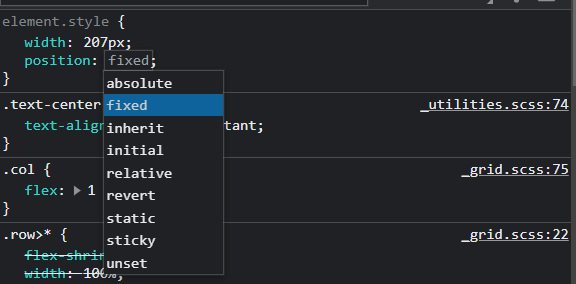
You can use the up and down arrows on your keyboard to change a numerical value (left) or scroll through a list of defined options (right).
The CSS panel will also validate CSS. If a property is crossed off, it means it’s being overwritten by another value that takes precedence. If a property has a yellow exclamation-triangle next to it, it means that its value is invalid. If a value is grayed out, it means that that value will not take effect because it requires a specific value for another property (for example, the “left” property requires particular values for the “position” property). In this case, the info-circle next to the grayed out property will explain why this value isn’t being applied.
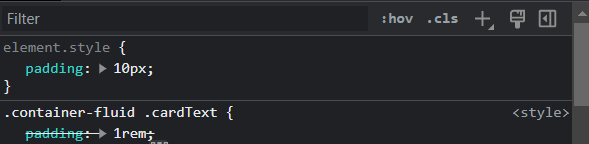
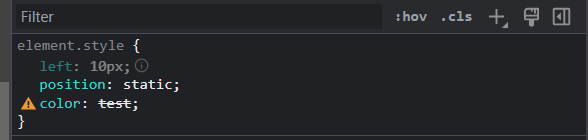
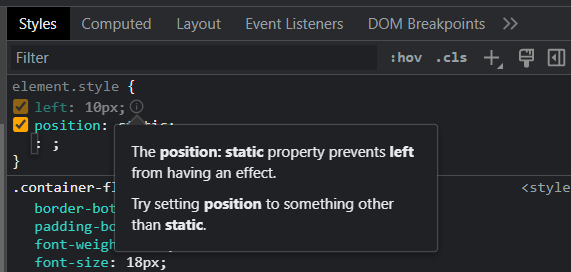
A more specific property that overwrites a less specific one (top left), an invalid property (bottom left) and a property that requires certain values for another property (right).
Finally, you can use the Toggle Element State button (labeled :hov) to see the effects of actions such as hovering or focusing on an element, as well as access and edit the CSS associated with those states. This is important as CSS for element states is otherwise not visible in the inspector.
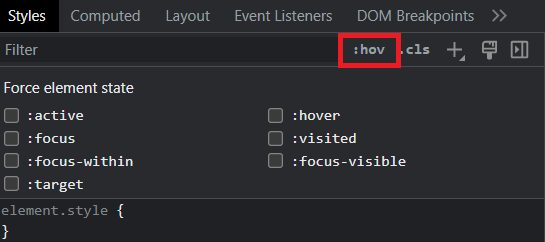
The Toggle Element State tab allows you to apply various element states.
The Elements tab is an important tool for visualizing and testing HTML code and CSS properties, and for understanding how the code you write translates into what the user sees. It’s also only one of the tabs in the Dev Tools. Stay tuned for future articles that provide deep dives into each of the other tabs!
In Summary
We hope you’ve found this brief overview of the Elements tab in Developer Tools useful. These tools can greatly improve your coding experience and help you create better web applications. They are also useful when working out an issue with support technicians.
We will continue our deep dive into the uses of each tab in future articles, so stay tuned to learn more!