


Any modern browser you use to access the internet has something called “Developer Tools,” “The Developer Console,” or something similar. Collectively, these are commonly referred to as Dev Tools. Almost every web developer will leverage them, but what are they? In this article, we’ll give a brief overview of Dev Tools and their functionality. In future articles, we will go more in-depth on some of the different components.
Note: For the purposes of this article, we will be using the Dev Tools in Google Chrome. If you are using a different browser, your Dev Tools may look slightly different.
What are Dev Tools?
Dev Tools are designed to help developers test, debug, and build upon the code that makes web pages work. With them, developers can try out visual adjustments without having to edit and upload files repeatedly, monitor the information the web page is sending out, test how different inputs impact the code running on the web page, and more. Even if you’re not a developer, the dev tools can provide information that can be used by support technicians if you ever have to report an issue with a web page, so familiarizing yourself with them can help solve problems faster and improve communication. Each of the sections below will focus on one of the tabs you see in the Dev Tools and briefly explain what it does.
Elements
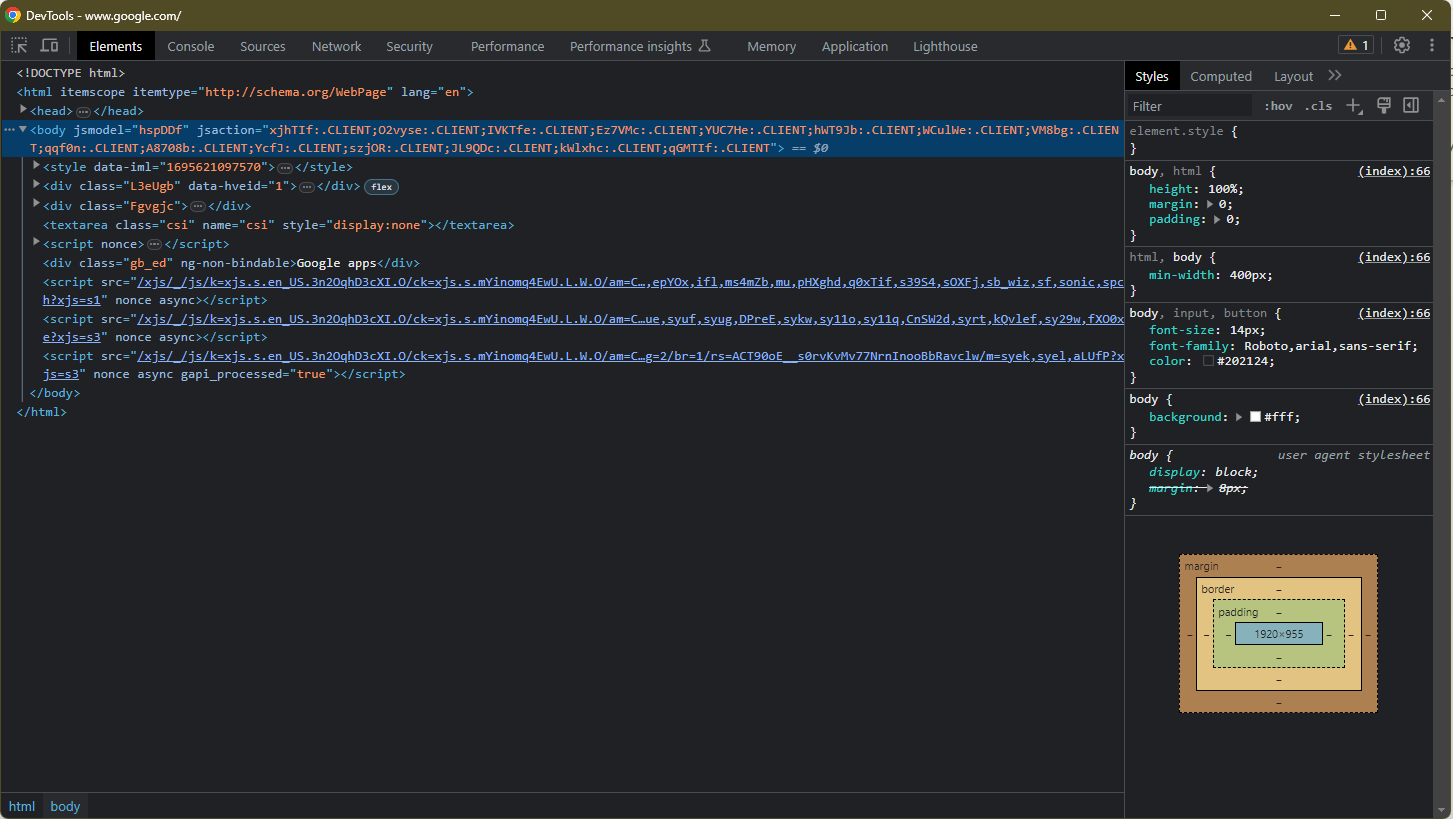
The “Elements” tab of the Dev Tools is primarily used for exploring and testing edits to the HTML and CSS of a web page. These determine how a web page will look to a user. By using this tab, web developers can test different layouts, colour schemes, and other visual elements without having to edit code, upload the changes, refresh the web site, and navigate to the specific portion of the web page in question. This saves a lot of time and effort in design and testing.
Console
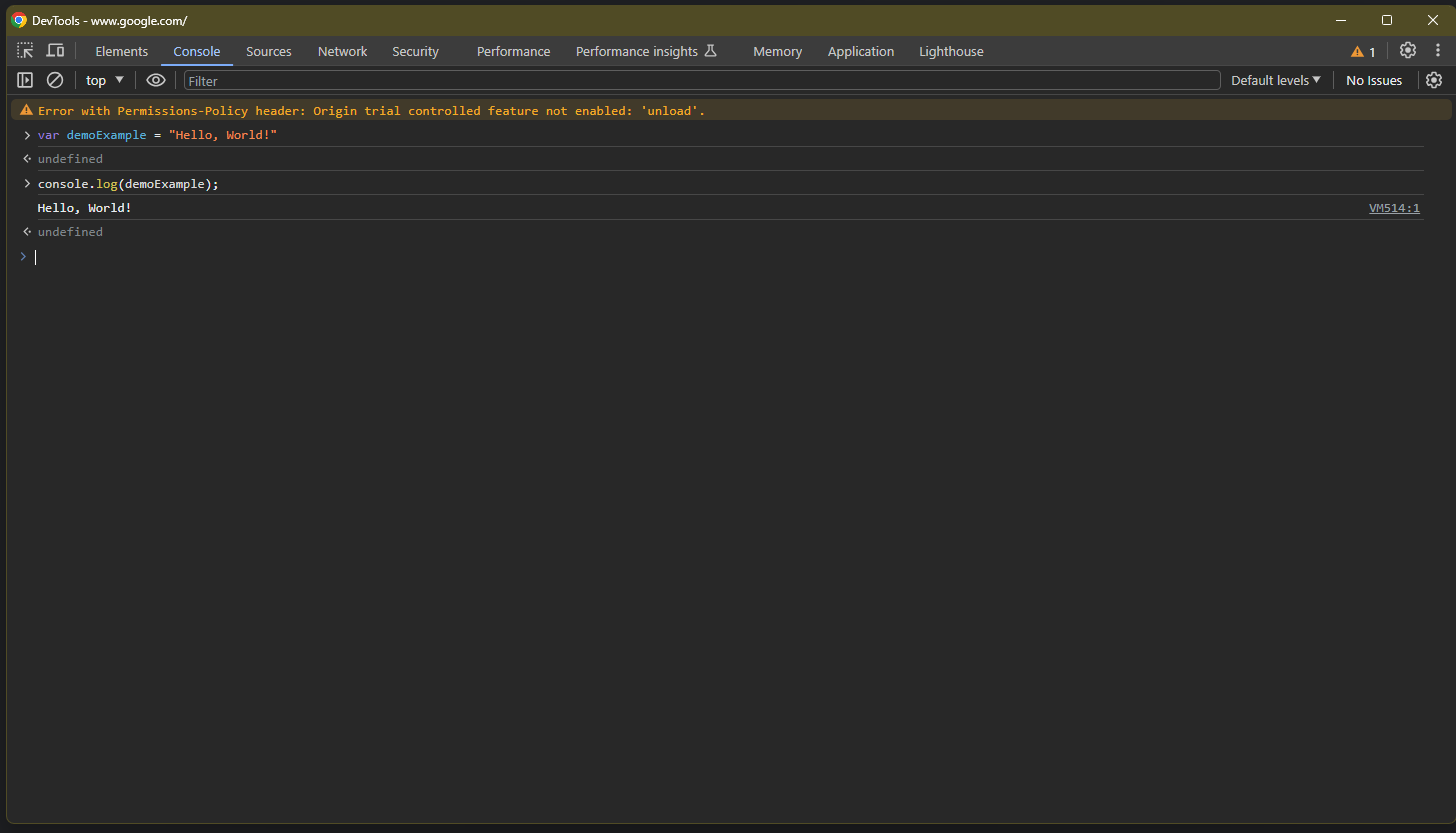
The “Console” tab is a frequent resource for getting information about what is happening on the client-side of a web page. It will display notices about information, errors, and warnings encountered while running the web page. Developers can also use it to test scripts. This can be helpful when debugging code or quickly trying to verify a snippet has valid syntax. You can even use some of the elements of the web page as variables for testing code. This is common for verifying simple functionality, like making sure the web page knows when you click a button. Make sure you understand any code you enter into the console, as executing code obtained from a non trusted source could lead to security problems.
Sources
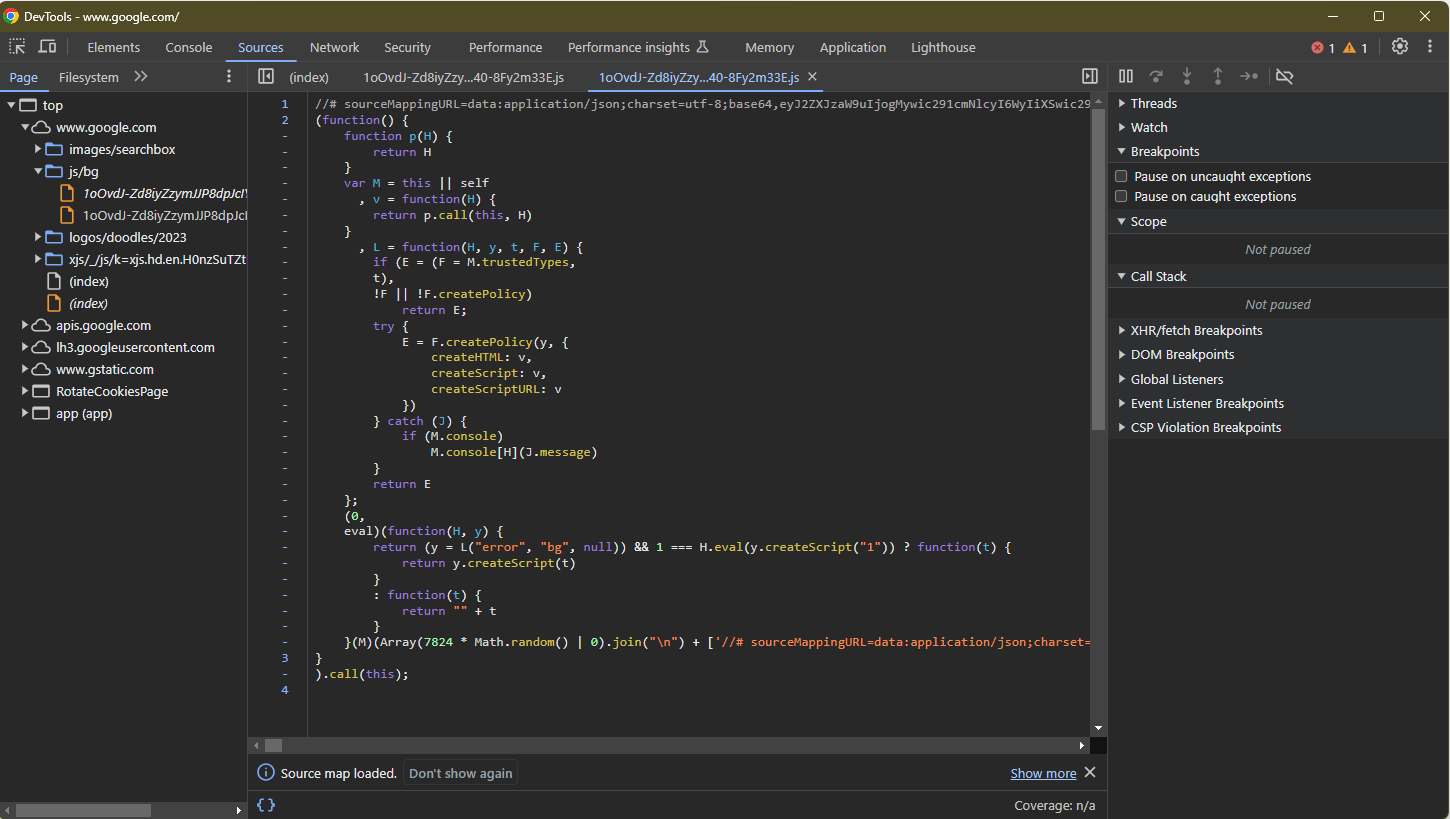
The “Sources” tab displays all of the files that are used to render the web page client-side. For just about every website that exists, this is generated on a server based on variables you’ve provided – such as when you share your location data to find the nearest restaurant for your favorite chain. The server then generates the files needed to display the custom version of the website with the information for you, and uses the internet to send those files to your computer. Your computer then reads those files to show you the webpage you see now. If you want to see those files, you would check out the sources tab. (Note that many websites will abstract a lot of the functions that perform core functionality.) Web developers would use this tab to make sure all the appropriate files are loaded in, add break points to stop and check information partway through a process, or view how variables in the code change as they move through various functions.
Network
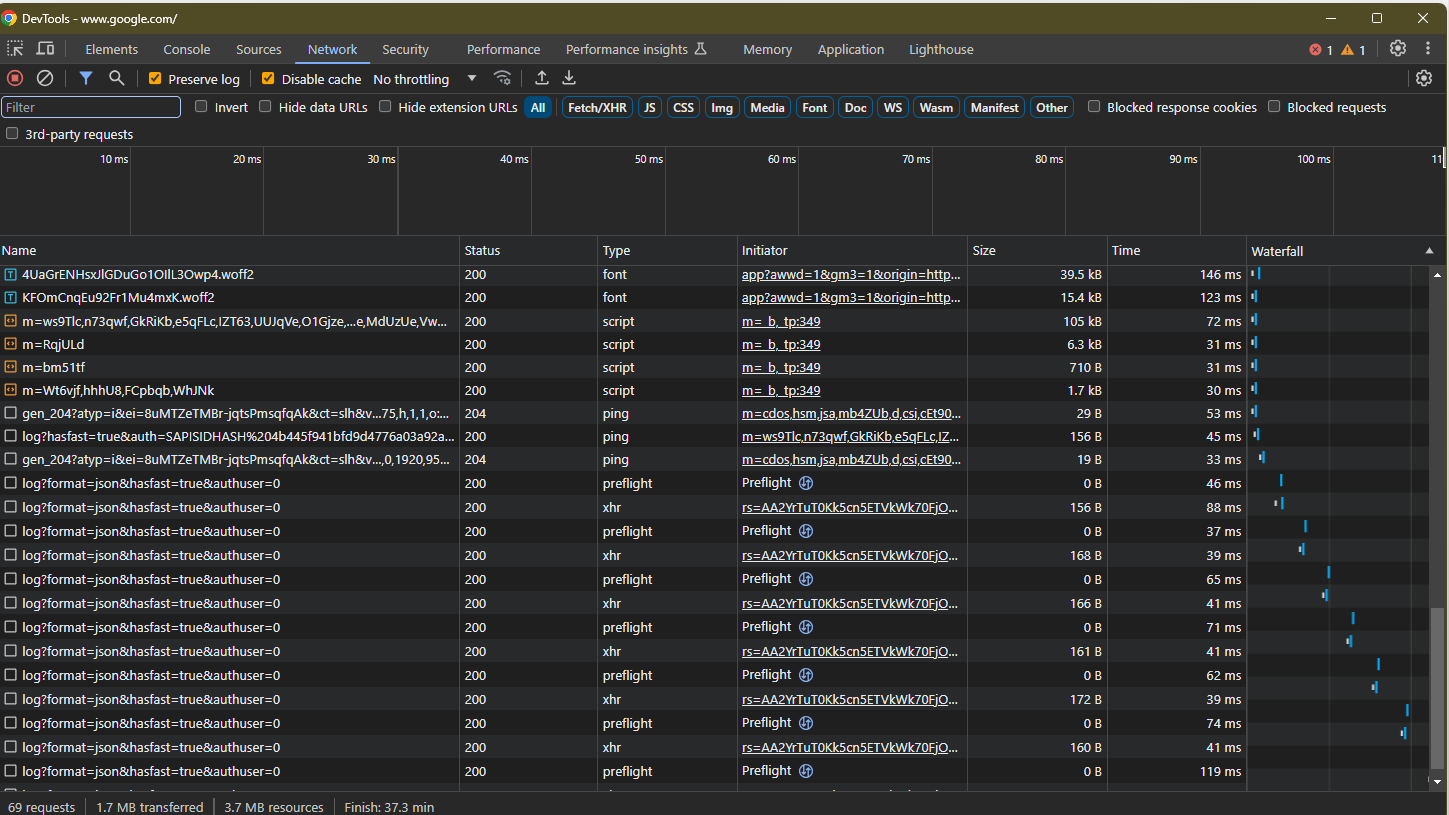
The “Network” tab lets you monitor the information a web page is sending and receiving from a server. It is where I spend most of my time when I’m troubleshooting as a web developer. The information can be something as simple as getting fonts and images to style a web page and fill out its content. It can also be more complex, like the geographic area you’d like to generate a drive-time analysis for, the radius for the analysis, projection you are working with, and units you’d like the results displayed in.
Security
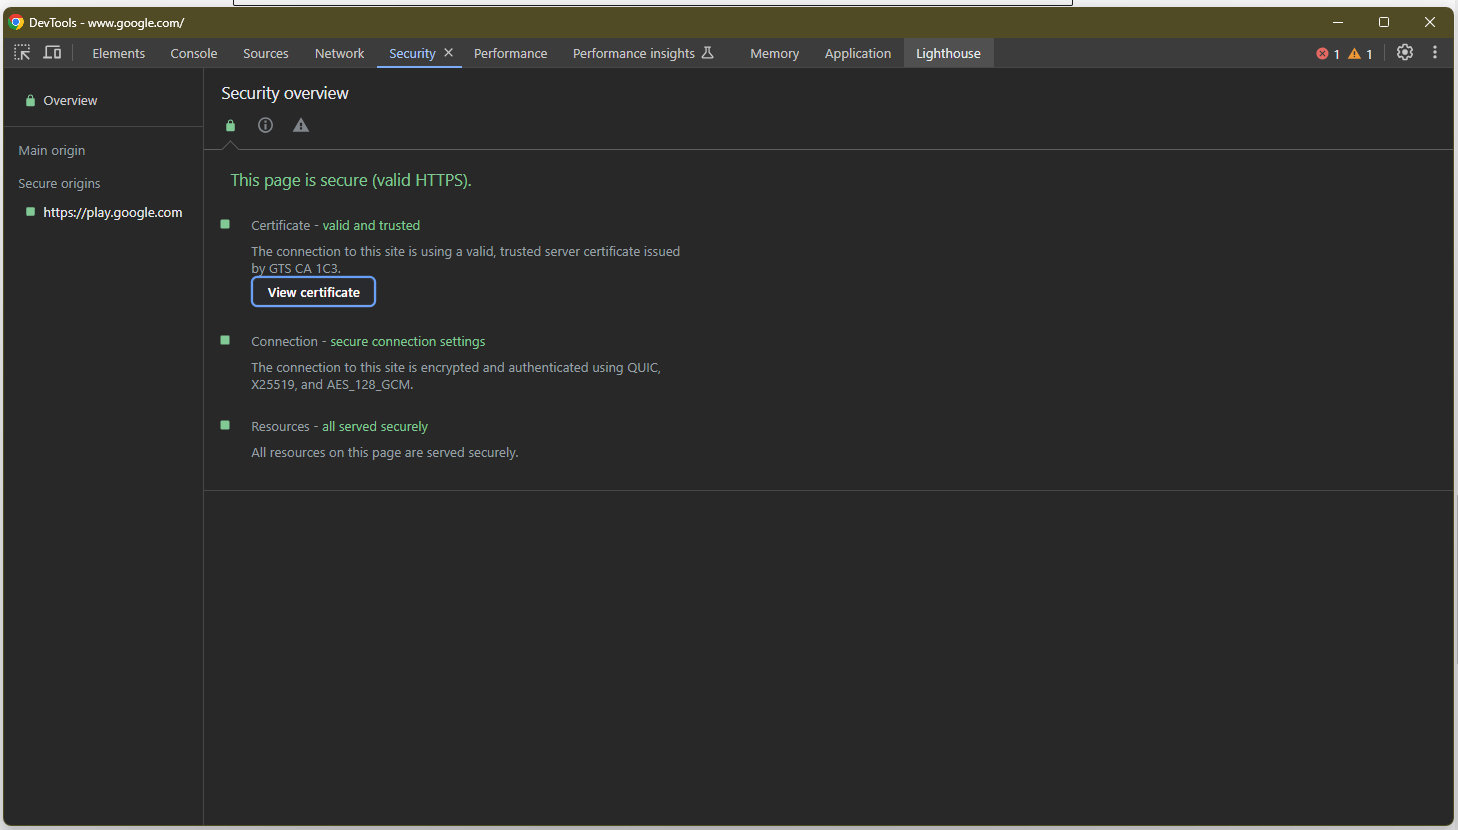
The “Security” tab presents basic information about how the web page you are looking at is verified. If you are ever curious, you can check out a web page’s security certificate – the thing that makes it “HTTPS” instead of “HTTP” – there. If the website relies on additional resources (and many do), you can also check that security information. The Security tab doesn’t come up often, but you are certainly glad it’s there when you do need it.
Performance
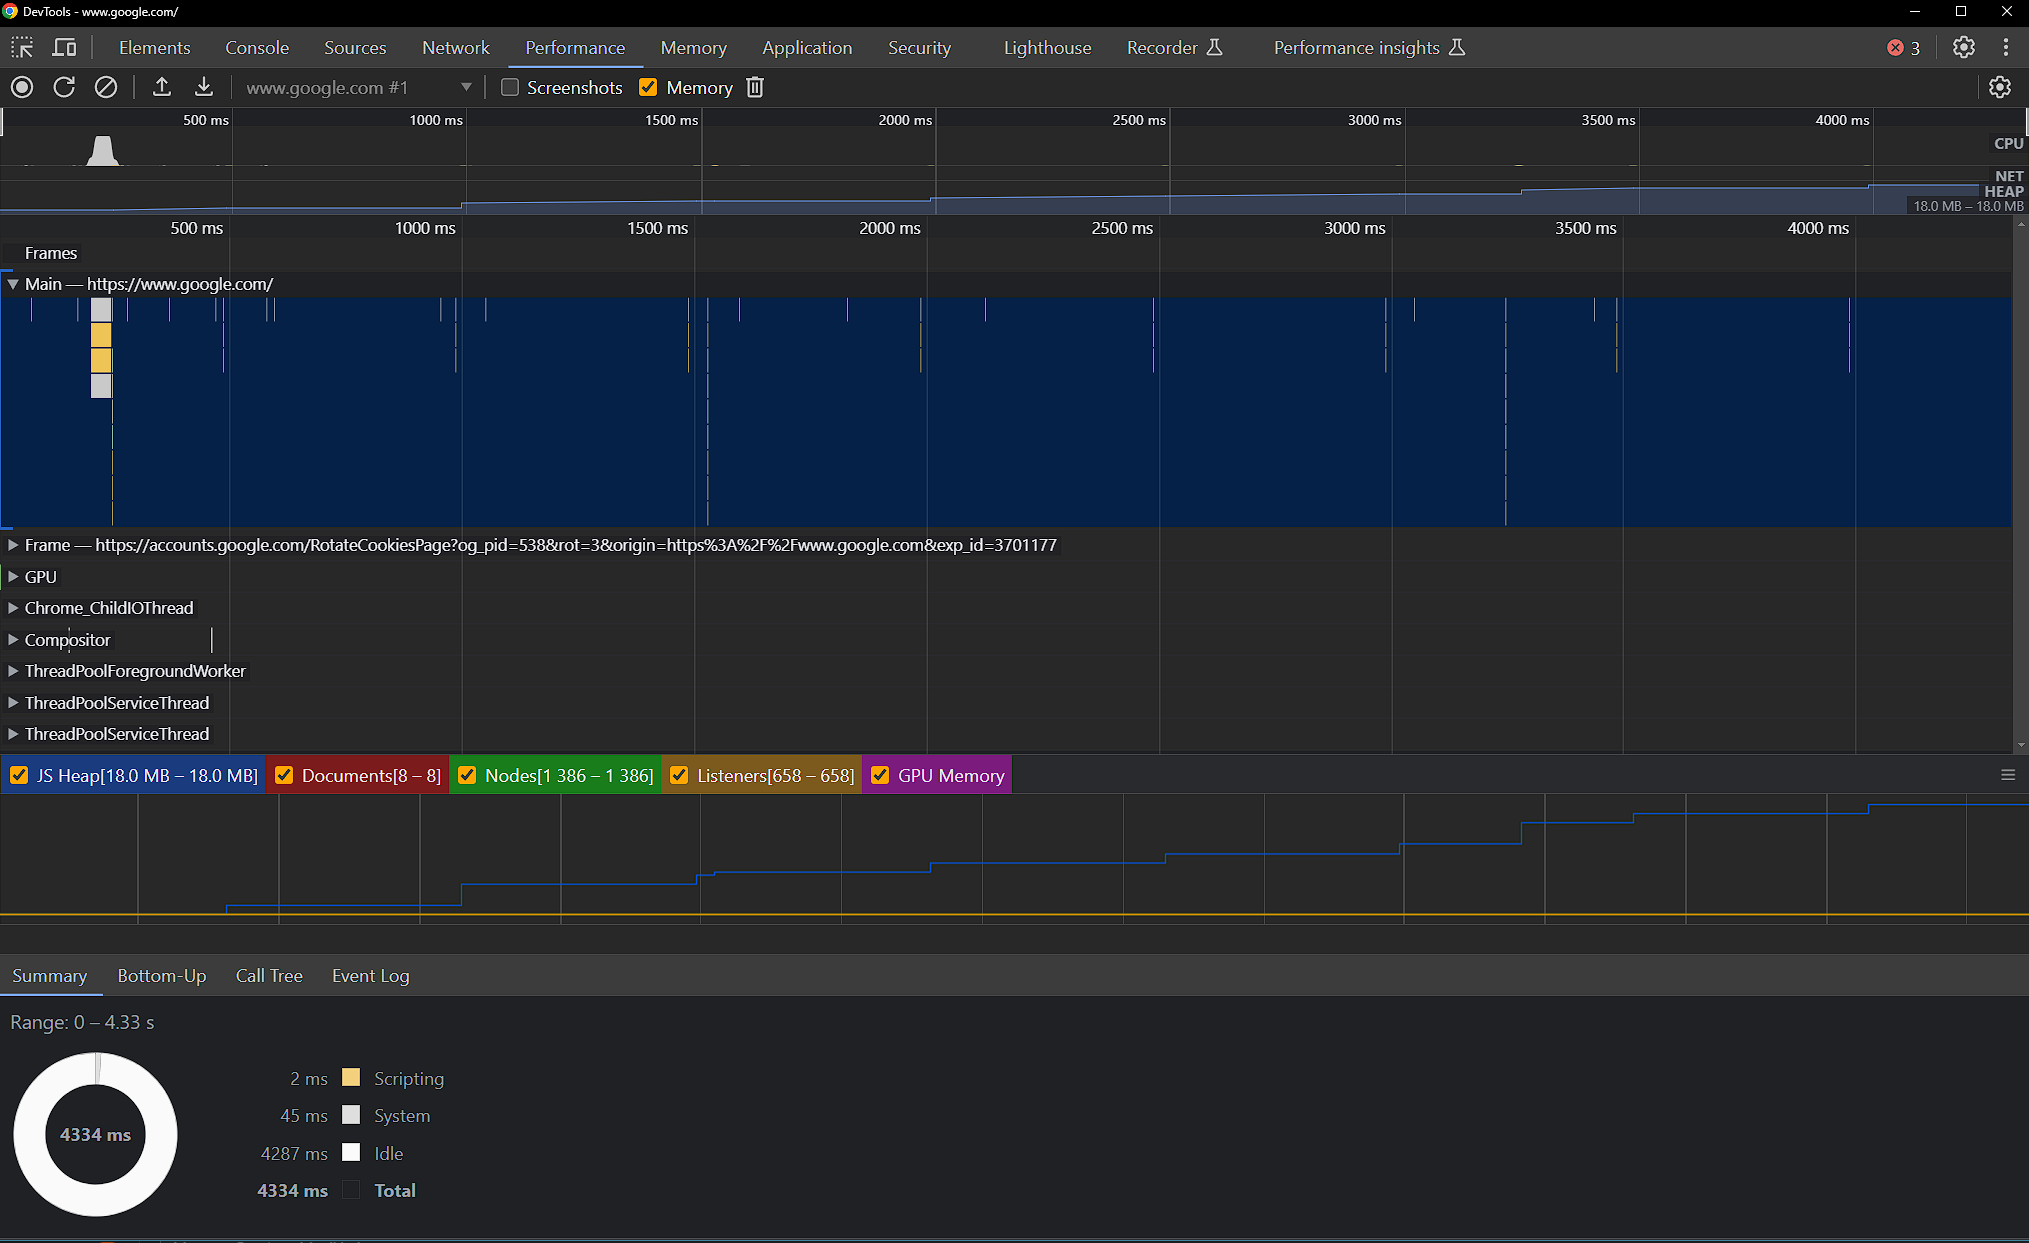
The “Performance” tab presents information on the resources being used by the web page. To start recording a performance snapshot, you can either press the ‘record’ button at the top left of the page, or press the ‘start profiling and reload page’ directly to the right. The first option can be useful when you want to analyze the performance of something triggered by user action, and the second is useful to analyze start-up performance of the web page. The Performance tab can be very useful when optimizing resource usage during development.
Memory
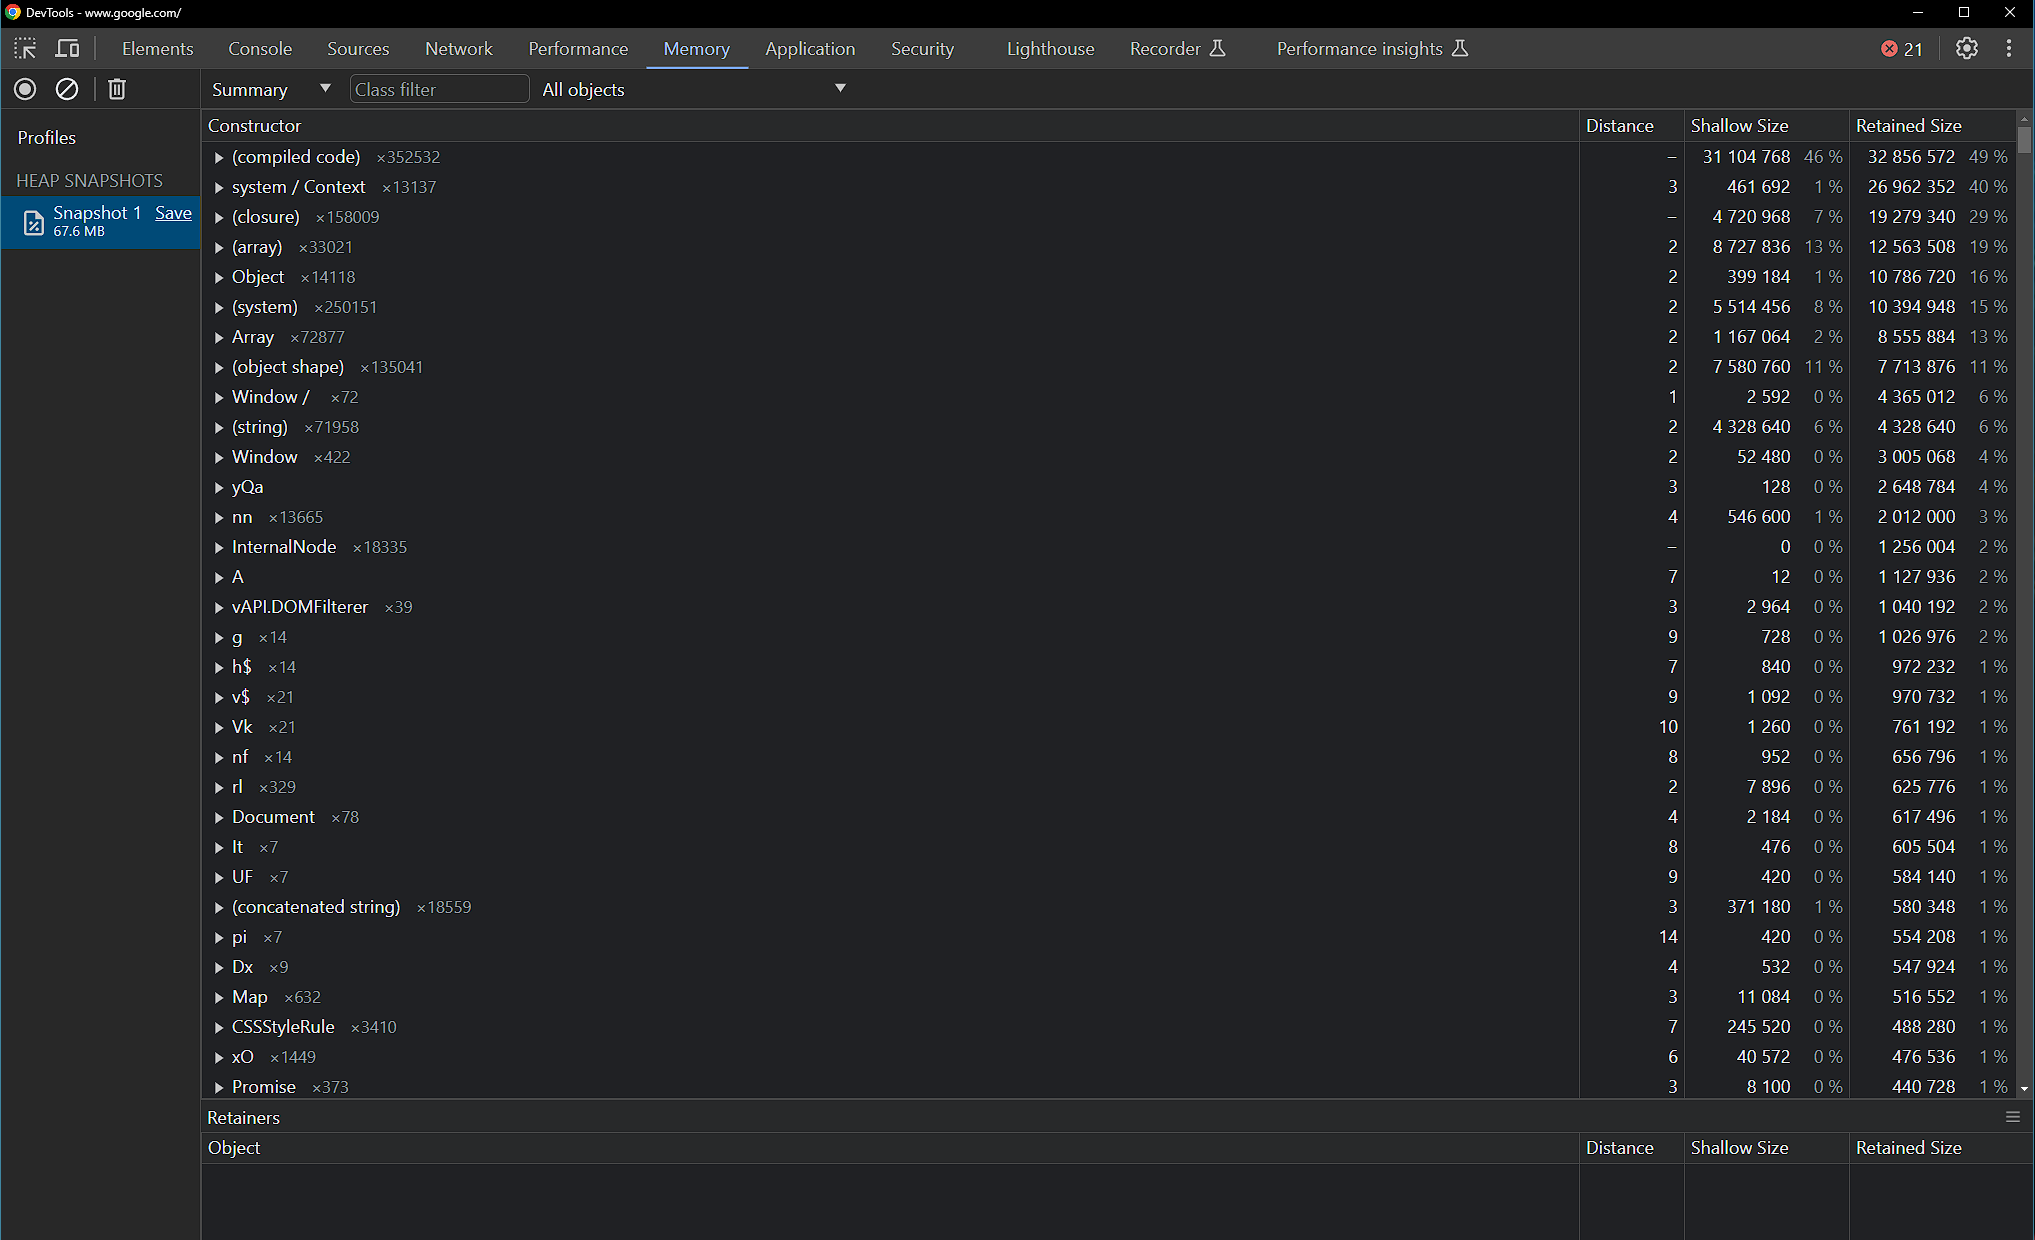
Similar in use to the “Performance” tab, the “Memory” tab allows you to take a snapshot of the current memory usage of a web page. To do so, press the take heap snapshot button at the top left of the page. By taking multiple snapshots over time, a developer can track down memory leaks and bloat, which could cause the web page to slow down or even crash.
Application
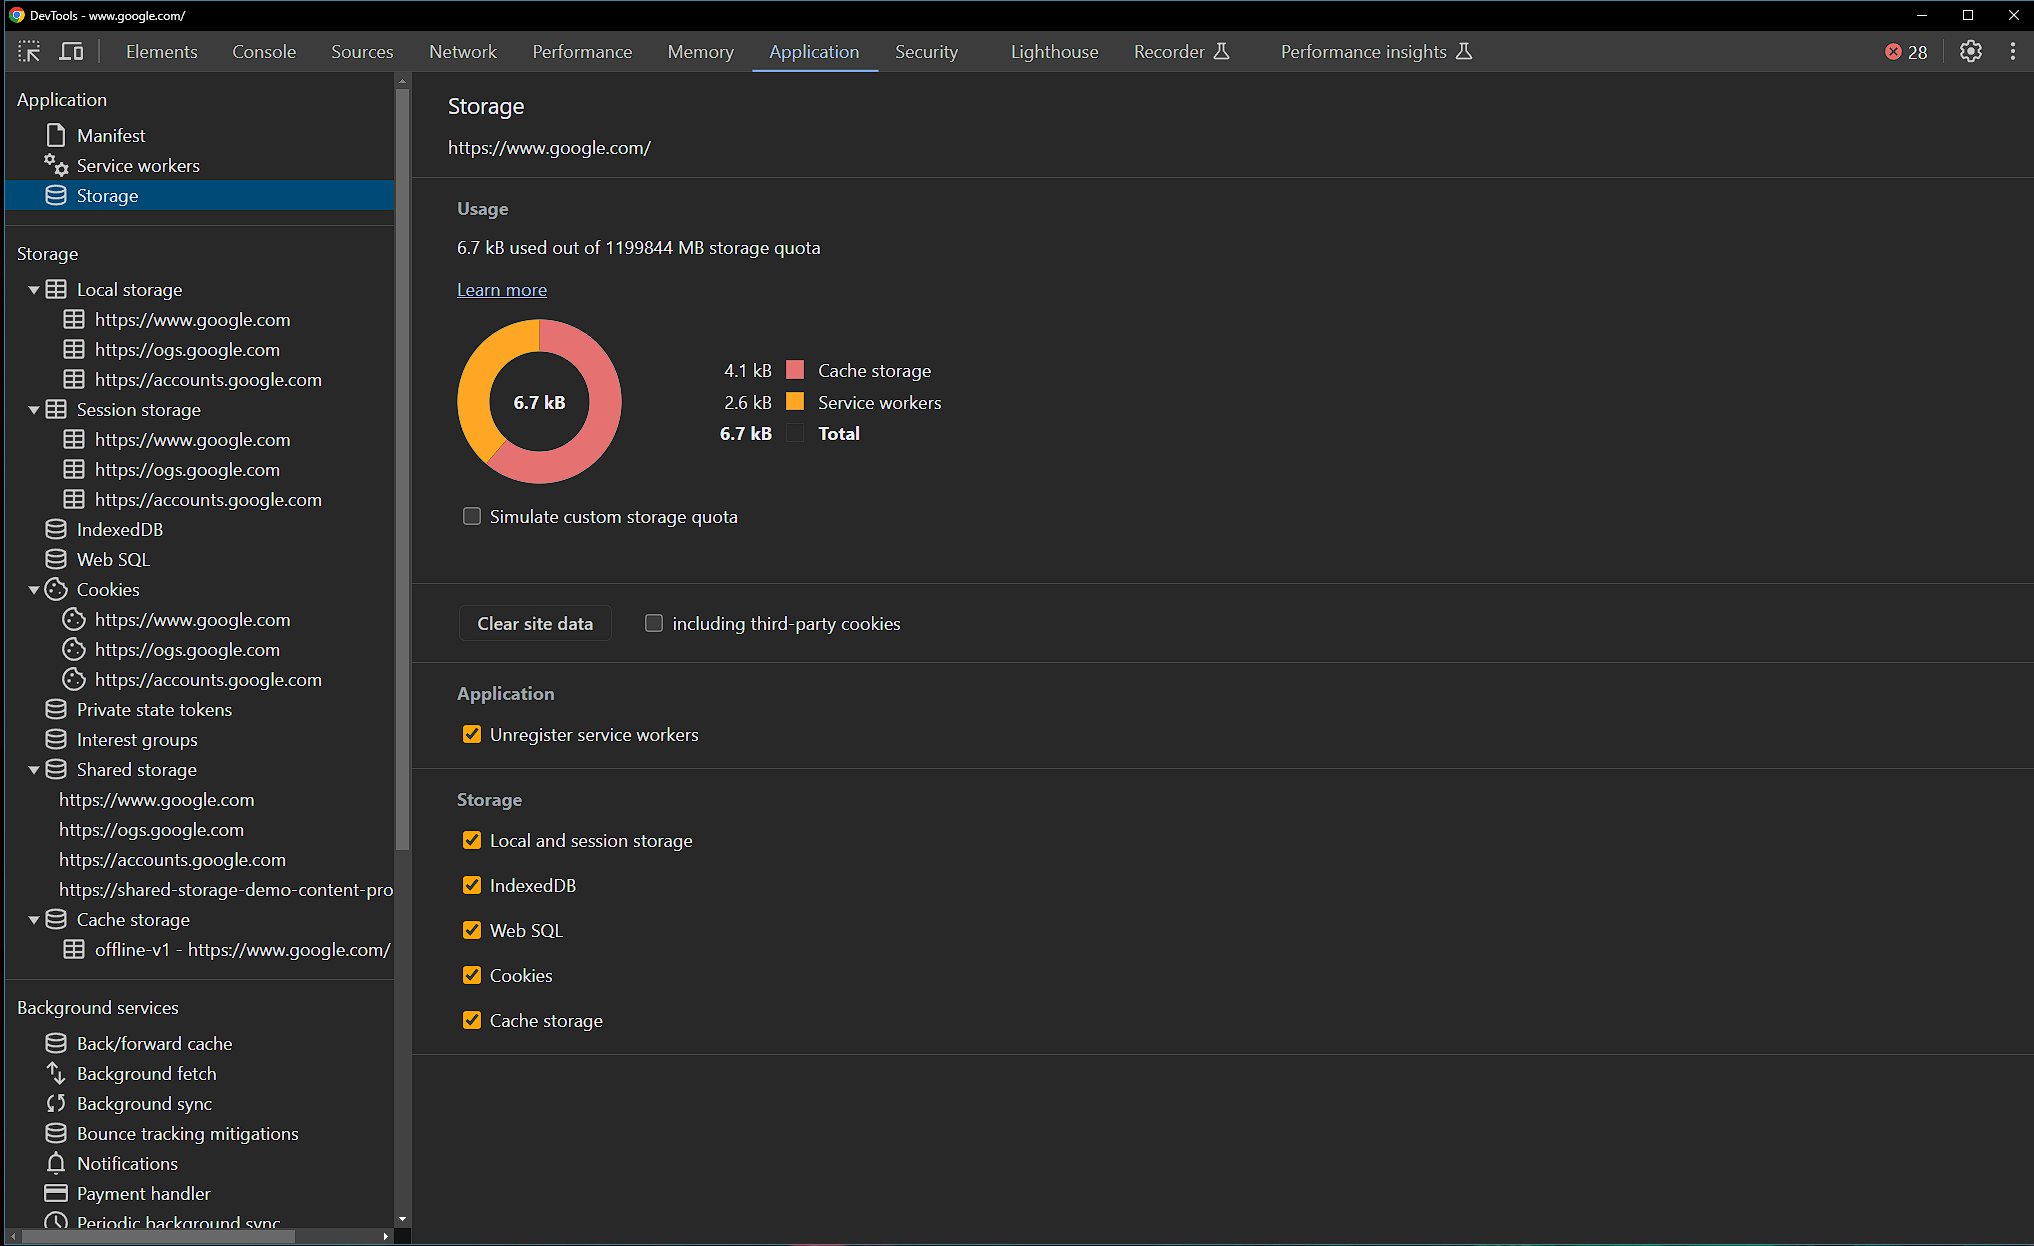
Next up is the “Application” tab. This tab lets you more easily debug progressive web apps, and also allows you to view and edit local storage, session storage, and browser cookies. This tab contains advanced tools that can be useful for experienced developers, and will be expanded on in a future article as we dive deeper into the dev tools.
In Summary
This has been a brief overview of the most used tabs in the developer tools. These tools can greatly improve your coding experience, and help you create better web applications. They can also be useful when working out an issue with support technicians. We will be diving deeper into the uses of each tab in future articles, so stay tuned if you are interested in hearing more!
Future Reading
Want more from GEO Jobe? Check out these other recent articles: