


Leveraging Rasters for a Spatiotemporal Analysis
When data is collected across different time frames spatially and then brought together in one collection to create a spatiotemporal model, this allows the user to visually see spatial patterns in a given location over time. Spatiotemporal data is very powerful for observing growth, patterns, and changes with respect to time. A couple of examples of leveraging spatiotemporal data are tracking the growth rate of invasive vegetation, urban growth or even urban decay in cities, natural disaster patterns, and so much more.
In this article, we will be going through the process of creating an image service for a time slider. We will use ArcGIS Pro to create a mosaic dataset and configure the rasters to be used for our spatiotemporal layer.
Configure the Mosaic Dataset
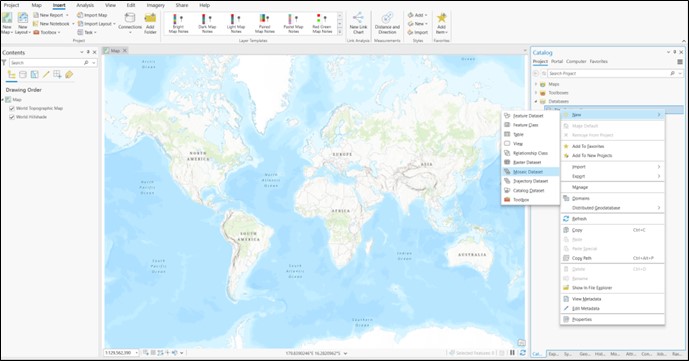
Once you have set up your Pro Project, you will right-click on the file geodatabase and go to New -> Mosaic Dataset.
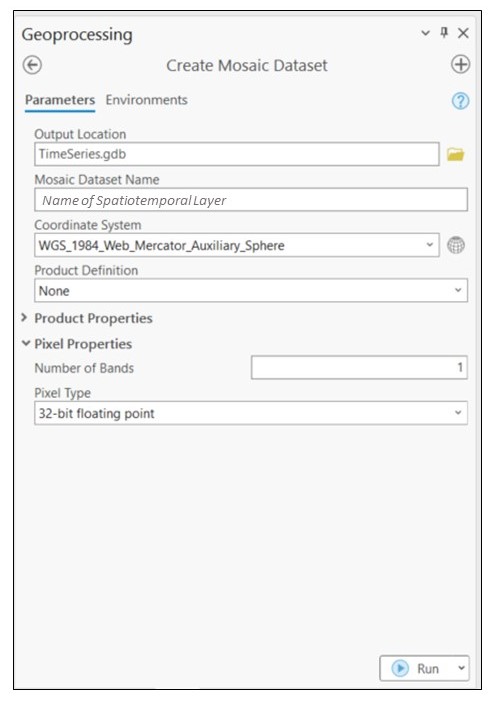
Once you have the geoprocessing tool Create Mosaic Dataset open, you will fill in the Mosaic Dataset Name with whatever you would like. Click the arrow next to Pixel Properties and add the Number of Bands and Pixel Type. The raster I was working with is 1 band and 32-bit floating point.
*If you are unsure of the bands and pixel type, just right-click the raster in your Catalog and go to Properties. Under Raster Information, look at the row Number of Bands, Pixel Type, and Pixel Depth.
Once you have everything filled out in the Create Mosaic Dataset, you are ready to Run!
Add Rasters
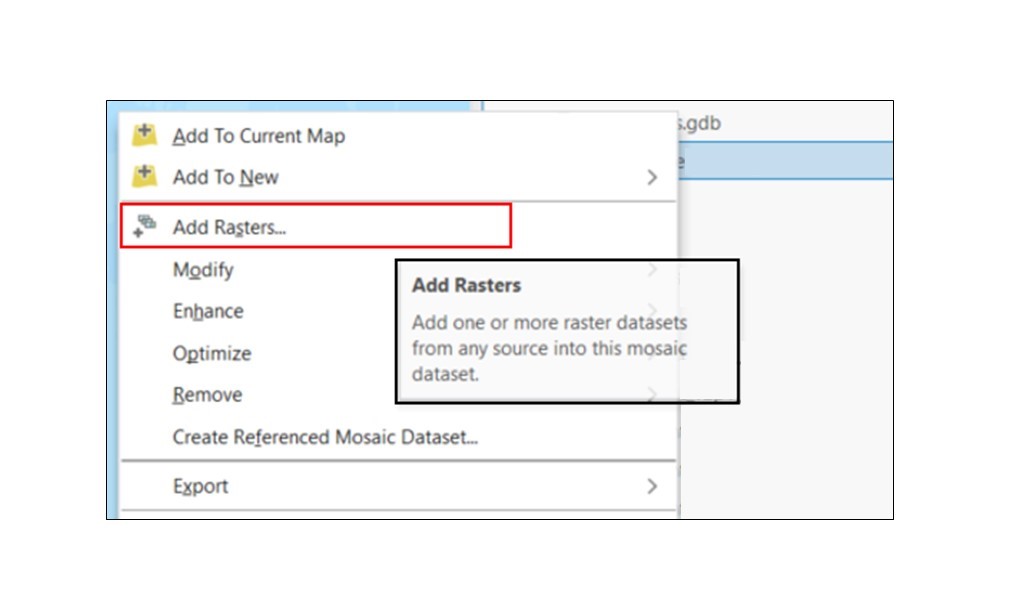
You will need to add your rasters to your mosaic dataset. To do this, go to Catalog, right-click the mosaic dataset, and then click Add Rasters…
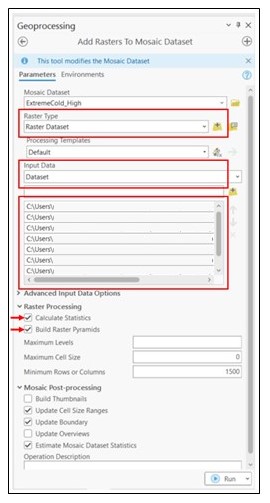
The parameters will need to be filled out like below:
Raster Type -> Raster Dataset
Input Data -> Dataset
Click the yellow box with plus to browse to where all your rasters are stored. Select all the rasters you want to add to your mosaic dataset.
Under Raster Processing make sure Calculate Statistics and Build Raster Pyramids are checked.
Click Run!
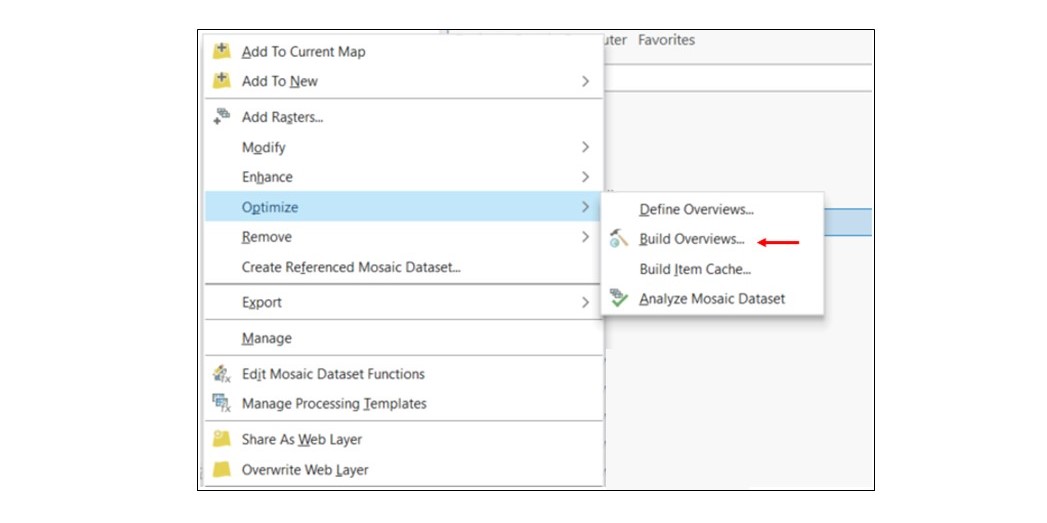
Build Overviews
Next step, you need to build the overviews. In Catalog, right-click your mosaic dataset and go to Optimize -> Build Overviews. Leave all defaults and click Run!
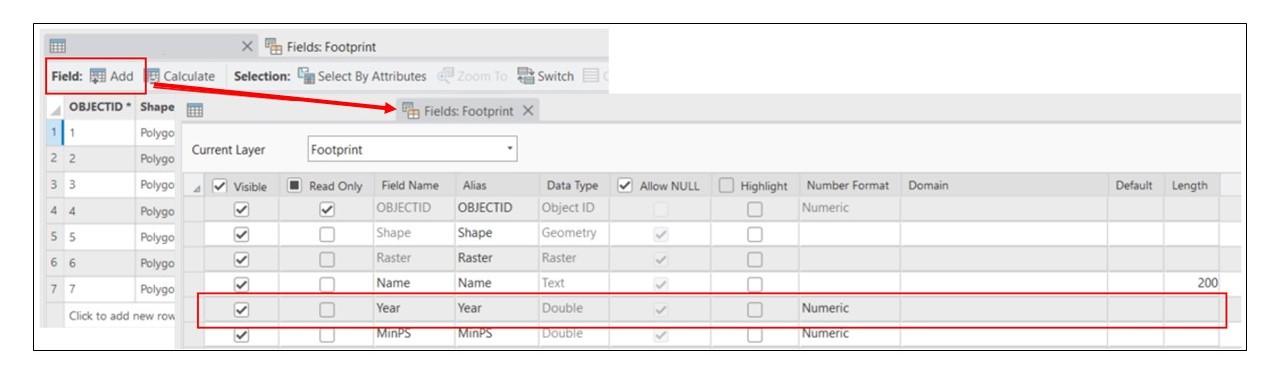
Add Fields Needed for Time Series
To get the time series to work on the rasters and set the correct parameters in the mosaic dataset, you must have a time field. You will need to add a field, whether it’s days, months, or years, to your rasters.
I needed years, so for my field, I called it Year. I set the Data Type as Double. Then, filled in the field with the correct values.
Change Properties of the Mosaic Dataset
To get the time series set up on the mosaic you will now need to edit the properties of the mosaic dataset before publishing. Go to Catalog, right-click your mosaic, and go to Properties at the bottom.
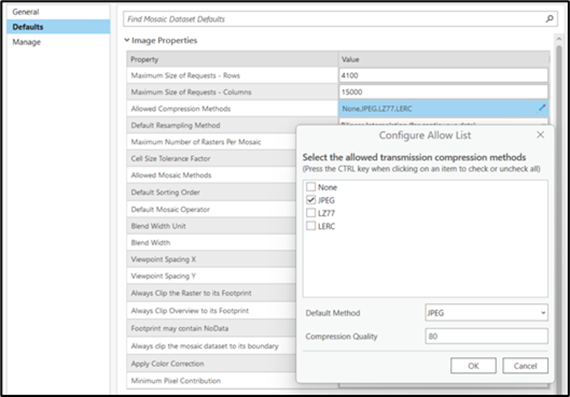
In there, you will need to go to Defaults and change the following:
- Allowed Compression Methods set to JPEG 80.
- Allowed Mosaic Method set to By Attribute, Year, and put a base value.
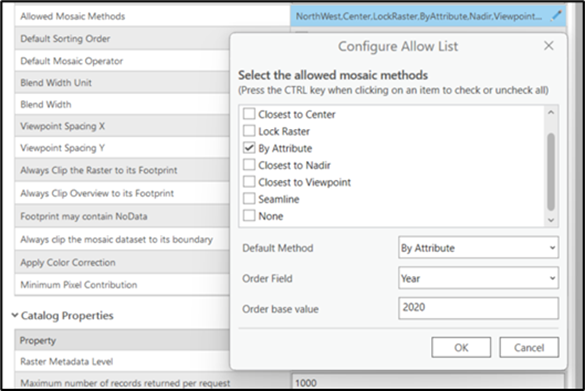
- Always Clip the Raster to its Footprints – Yes (Check)
- Footprints may Contain NoData – No (Uncheck)
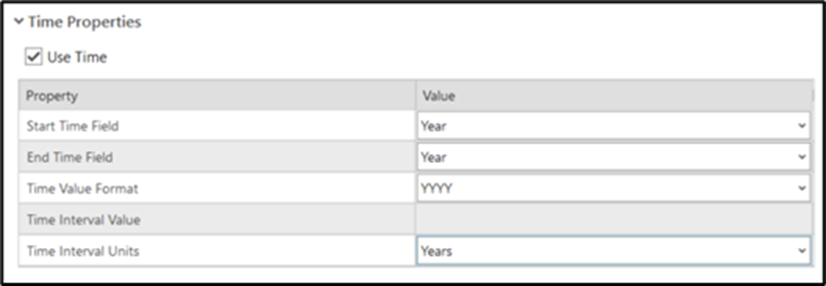
- Use Time – Yes (Check)
- Start Time Field – Year
- End Time Field -Year
- Under Time Properties, add Years as the Time Interval Units for the indexed field. This aids the performance.
Close out the window after all changes are made. You should now have a Time tab in the ribbon of your Pro Project.
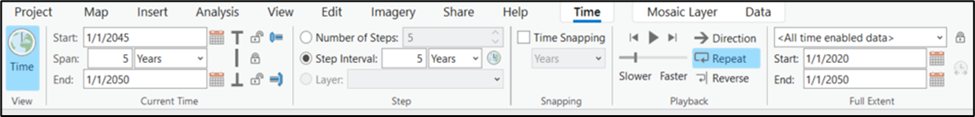
Working with the Time Slider in Pro
In the Time tab, you can change the intervals based on how many years are in between each raster year. You can also pick your start and end dates, along with time snapping, etc.
Here are the settings I changed based on the data I am working with.
Publishing to the Imagery Server
Publishing to the imagery server is different from publishing regular layers. To publish to the imagery server, go to Catalog and right-click the mosaic dataset. Click Share As Web Layer.
Fill in all the necessary information, and then in the Server and Folder, select your image server. Click Publish!
Note: Symbology changed in the map does not change the mosaic dataset. To change the symbology for your mosaic dataset, you will need to create a raster function template. Esri has a how-to: Apply a raster function template to symbolize classified data in a mosaic dataset or image service published from ArcGIS Pro. I used the Colormap function but changed the Color Scheme Type to Color Ramp.
There you go! Your layer is now published to your Portal and hosted in your Image Server! Your rasters have the configuration needed to do any custom time series you need.
Our Services
I hope these steps have helped you create your spatiotemporal collection layer. Do you need help building out a similar layer or creating an application to leverage your data? Reach out to our team for a free consultation, via e-mail today! We would love to talk with you and make your life a little easier!
Want to read more of our articles? Check out these that may interest you!
- Vanderbilt University: Landscape Planning with UAV Tech
- There’s No Place Like GIS: How Modern-Day Mapping Predicts Extreme Weather
- Enhancing Field Workflows with ArcGIS Field Maps using Related Tables
- Introducing Scheduler for ArcGIS: Unleash the Power of Automation in ArcGIS
- How to Reconfigure Layer Files in ArcGIS Pro