Written by Peter George and Tony Segero
Processing speed can be a major crutch in geospatial data analytics. Integrating Apache Spark’s analytics engine can help expedite the large data processing steps, increasing program efficiency and data exchange.
Fake it till you make it
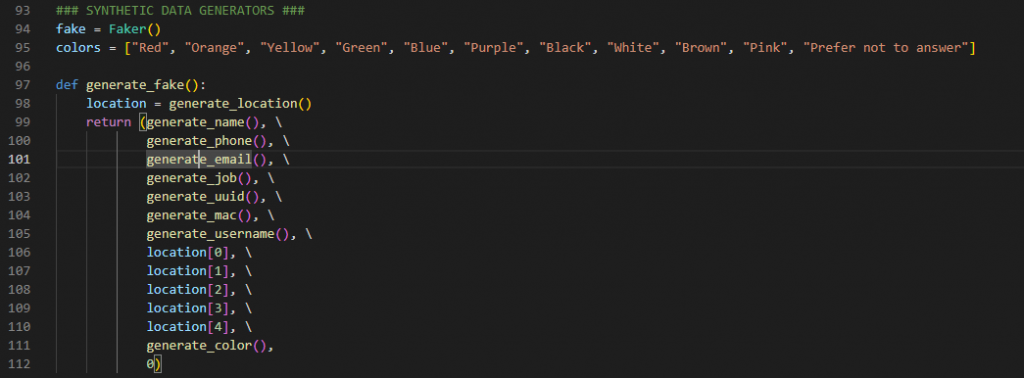
We decided to test using some larger scale streaming data processed with the help of Spark. Synthetic data was chosen, as to avoid personal identifiable information (PII) issues and provide repeatable results, as well as more control. A simple data generator application, written in Python, was created to run consistently and create synthetic data, with the help of some functions from the Faker library. A random number of data rows would be generated, batched, and received in various formats (Json, csv, SQL) and uniformly fed into a database.
Apache Spark and Kubernetes, Initialized
Initially, we wanted to utilize a Kubernetes cluster manager to manage the Spark clusters. Our initial development environment was set in Windows, and we quickly ran into an issue being unable to utilize KubeADM in Windows. Linux Subsystem for Windows worked as a fine alternative, but we proceeded at the time without K8s. Spark was configured next. Spark was configured to have a driver to run the main application, and several worker nodes with varying resources. Two slow runners were created via command line with 4 cores and 16Gb of memory each, and one fast runner with 8 cores and 64Gb.
Pyspark
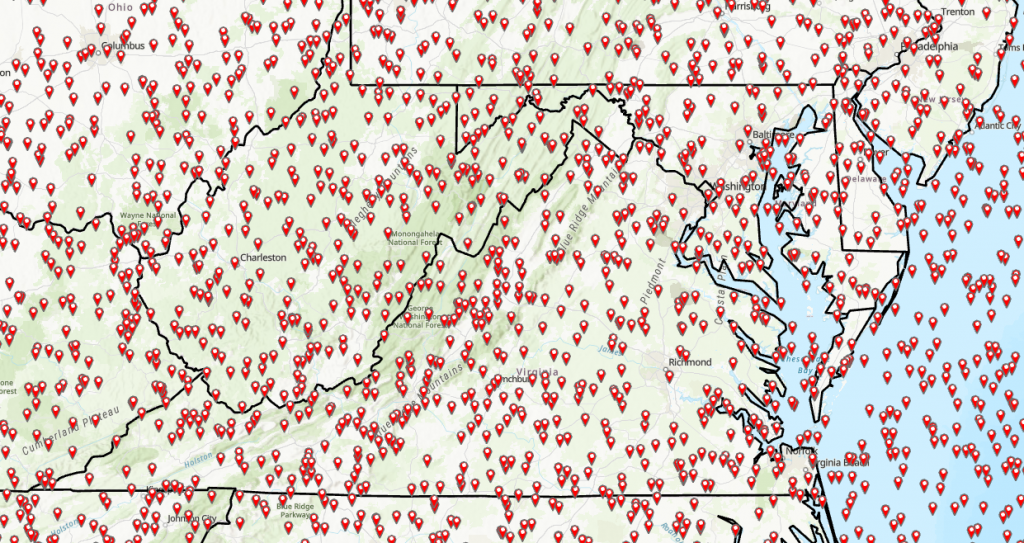
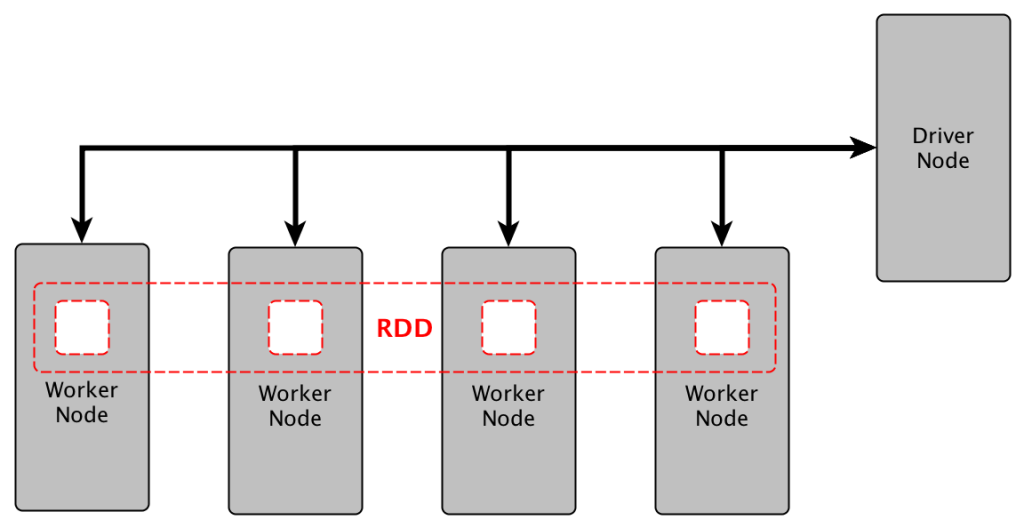
Data was flowing, and now we had clusters configured to run the scripts. Utilizing Pyspark’s SparkSession, we submitted the custom data ingestion applications to the Spark Master. These would pull and pool row data from Amazon s3 and/or local storage, and perform a very light ETL process (Extract, transform, load). The transformations done were reverse geocoding with another library called reverse_geocoder. This was due to a fault in Faker’s module, limiting the locations capable of being generated to only 161 unique latitude-longitude pairs, which was insufficient for a US-based demonstration. In its place, a bounding box surrounding the US continental area was created with random latitude and longitude pairs generated. The reverse geocoder would ingest these random pairs, and provide a nearest location in the form of place, state, and country. The data collection was parallelized and the reverse geocoder function passed into the Resilient Distributed Datasets (RDDs), which are a key component of the Spark architecture. This collection is fault-tolerant and can be operated on in parallel. Post-op, the dataset would recombine, and be loaded into a local storage location to be utilized in ArcGIS Enterprise on Kubernetes.
ArcGIS
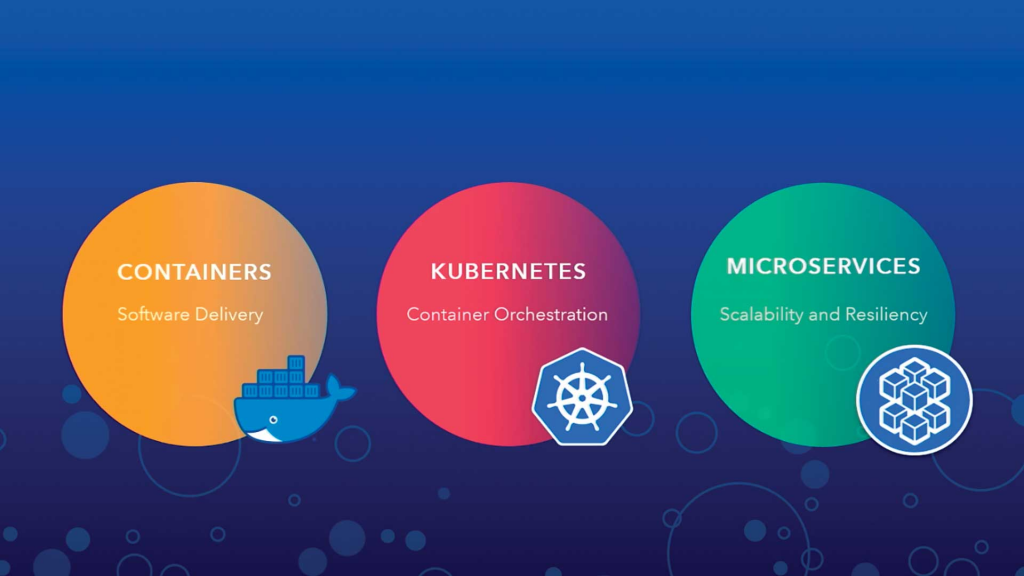
ArcGIS Enterprise on Kubernetes is a deployment option for ArcGIS Enterprise mapping and analytics software. It uses containerization and microservices to provide a cloud native architecture, running in your cloud provider’s Kubernetes service or your organization’s kubernetes platform.
Containers package an application or microservice with the libraries, binaries and configuration files that it needs to run successfully. A container runs on a shared operating system, making containers lightweight and able to run in any environment without modification.
Kubernetes orchestrates and manages the back-end processes that powers your GIS organization. ArcGIS Enterprise on Kubernetes provides self-healing, scalability, and resilient configuration management. It uses containers to run GIS processes as microservices which perform a distinct, focused function. Each microservice runs in a container that packages everything to run an application.
Steps to deploy ArcGIS Enterprise on Kubernetes vary depending on your environment. They include;
- System Requirements
- Architecture Profile
- A Kubernetes Cluster
- Nodes access to GIS Data Folders
- Authorization File
- Deployment Script
The ArcGIS Enterprise on Kubernetes deployment needed to automatically receive the data, so a model was developed, inspired by an Esri resource that would periodically read in the local storage (configured as csv already for convenience). The model first clips the data using a US Polygon layer to rid the randomized data pairs that ended up in the ocean or bordering countries.
Big Processing for Big Data
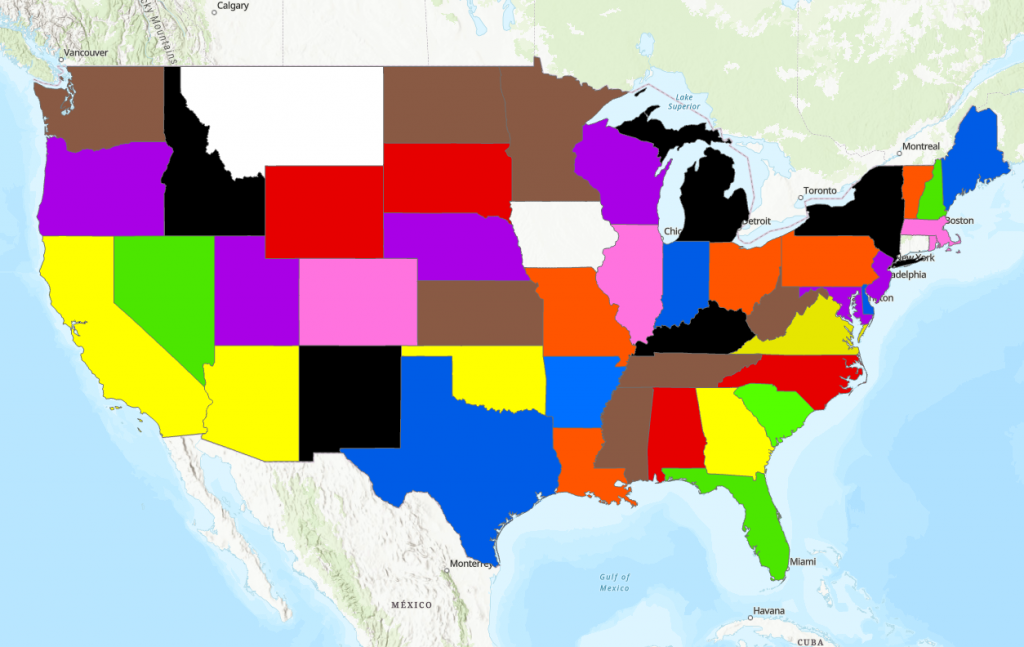
The remaining dataset gets spatially joined to the geographically related state polygon to associate the attributes correctly. Then a common field is calculated on the polygons and another spatial join to later re-join the outputs. The attributes are then summarized, the table pivoted, and then rejoined. This provides us with state polygon layers with rows of the synthetic data. Lastly, the points are collected over time to display the most recent data, the daily trend, and a weekly summary, all symbolized by a generic color field mocked in the generation process.The result is a continuously updating map that adjusts its symbology by the current majority and displays the current leading color.
Spark proved excellent in practice. Real world applications would scale past the quarter-gigabyte-per-second data feed generated here, and certainly have more robust and enticing features, but for a playground application, compared to a standard-run script, reverse geocoding and processing was handled about 2.5 times faster on average. In the finale, Kubernetes as the cluster manager never came to fruition in this iteration, and a few other aspirations were left to the future horizon. The future project scope includes adopting AWS Kinesis for streamable, malleable storage, K8s management, Spark MLlib functions, and more of Spark Streaming, as well as some automated prediction in ArcGIS, and the improved data.
For more information on Spark, Apache Spark docs has a fantastic section on programming guides, and SparkByExamples has a ton of hands-on demonstrations and in-depth understanding of both Spark and PySpark, both of which proved invaluable in our journey. For Kubernetes, the best resource I’ve discovered has been aCloudGuru’s learning course on K8s, which provided video learning as well as repeatable hands-on learning labs. Finally, Esri hosts many free and diverse learning experiences, which provide valuable insights, allow you to view projects from new perspectives, and dive deep into resources that have been underutilized.
If you are interested in learning more please reach out to us at connect@geo-jobe.com


