

The usage of real-time GIS capabilities has grown significantly over the last few years as more and more devices have started including location information with other sensor information. Naturally, the need for platforms capable of ingesting and analyzing these data has also grown. Recently we’ve seen advancements to make analysis platforms more capable and better able to receive and process large volumes of data in real-time. To meet these needs, Esri now has three products available to consumers: the GeoEvent Server and GeoAnalytics Server products allow users to install and configure these capabilities in their own environments, and ArcGIS Velocity provides a cloud-native option for users that prefer to leverage the technologies without having to manage the underlying infrastructure.
Gaining Velocity with mappy
Over the last few months, GEO Jobe has had the opportunity to work with mappy, a mobile app developer and data analytics company revolutionizing the guest experience through analysis and socialization of geospatial movement. Their first mobile app, Snow Mappy, allows users to explore ski resorts with 2D & 3D maps, navigate resorts with turn-by-turn navigation, and stay connected with family and friends using groups within the application. mappy is also part of Esri’s Startup program and, through this partnership, GEO Jobe was able to test ArcGIS Velocity’s capabilities using data collected from Snow Mappy users.
In its essence, ArcGIS Velocity is a platform that combines capabilities of GeoEvent Server and GeoAnalytics Server into one software-as-a-service (SaaS) platform. This gives you the ability to ingest and process real-time data and perform big data analytics that creates output feature layers for visualization in web maps and applications.
Our work with mappy and ArcGIS Velocity primarily focused on using data captured during a ski season to analyze patterns and determine how Snow Mappy users were using different ski resorts. For example, we were able to separate skiers by skill level (difficulty preference is a setting that users choose within the application) and create a big data analytic to visualize runs used by these users as well as their average speeds:
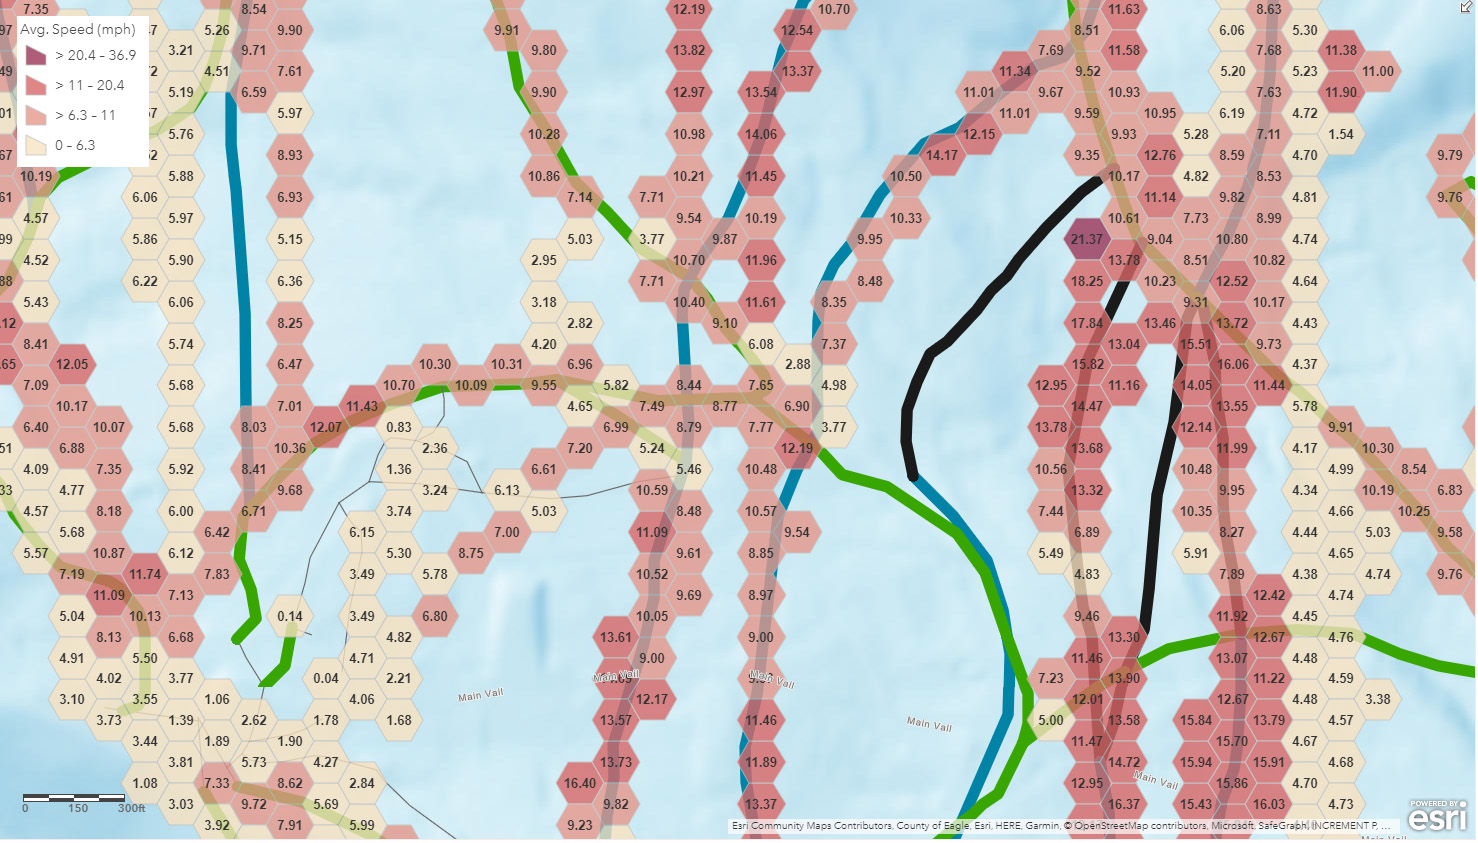
for skiers who had set their difficulty preference to “Expert”.
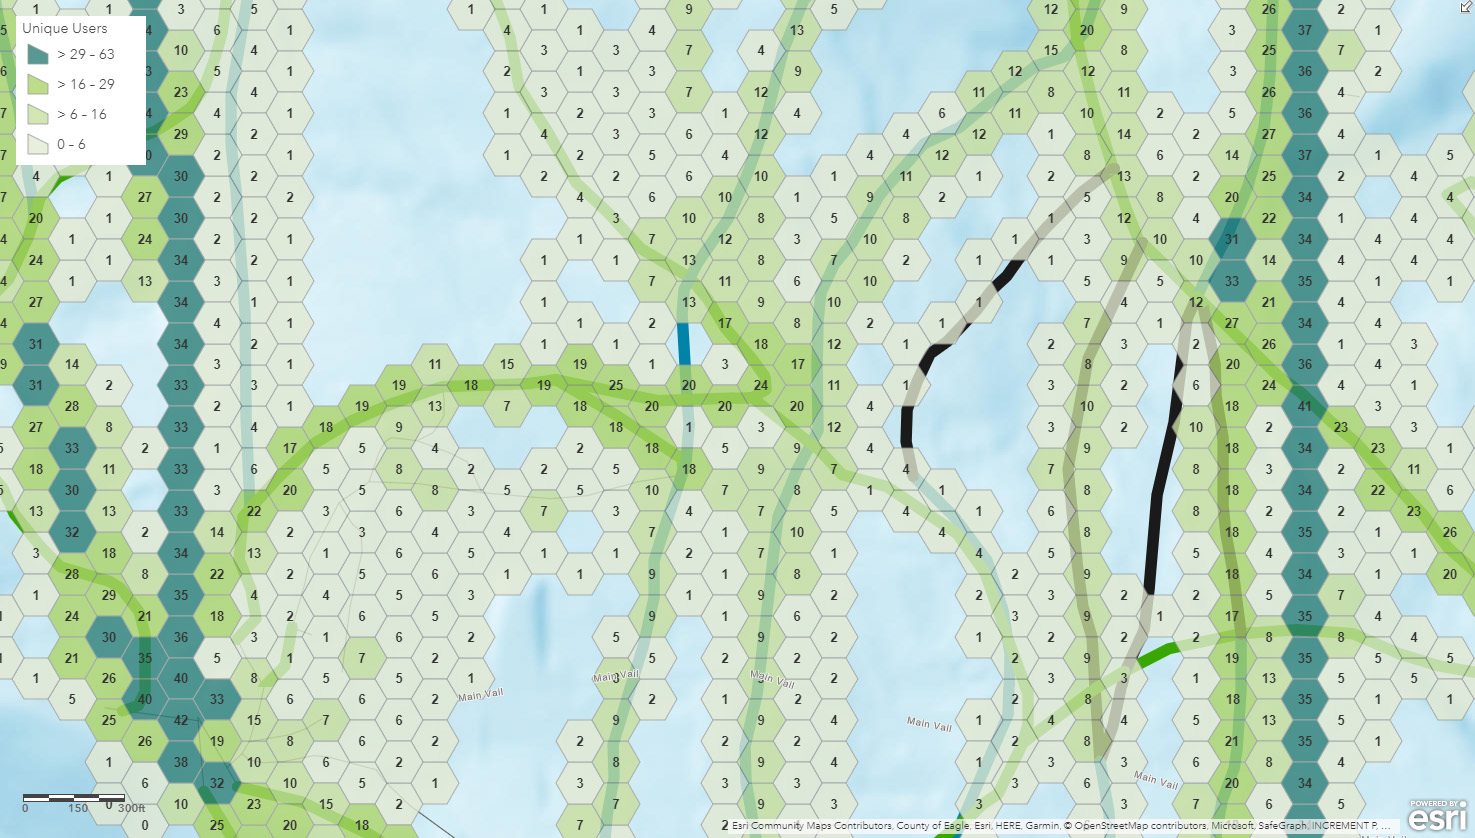
Additionally, we used big data analytics to look at skier days (number of unique days skiers were on the mountain) and how many individual users were on the mountain during the app testing periods:

This shows a count of how many days particular runs were visited.
Connecting with Velocity
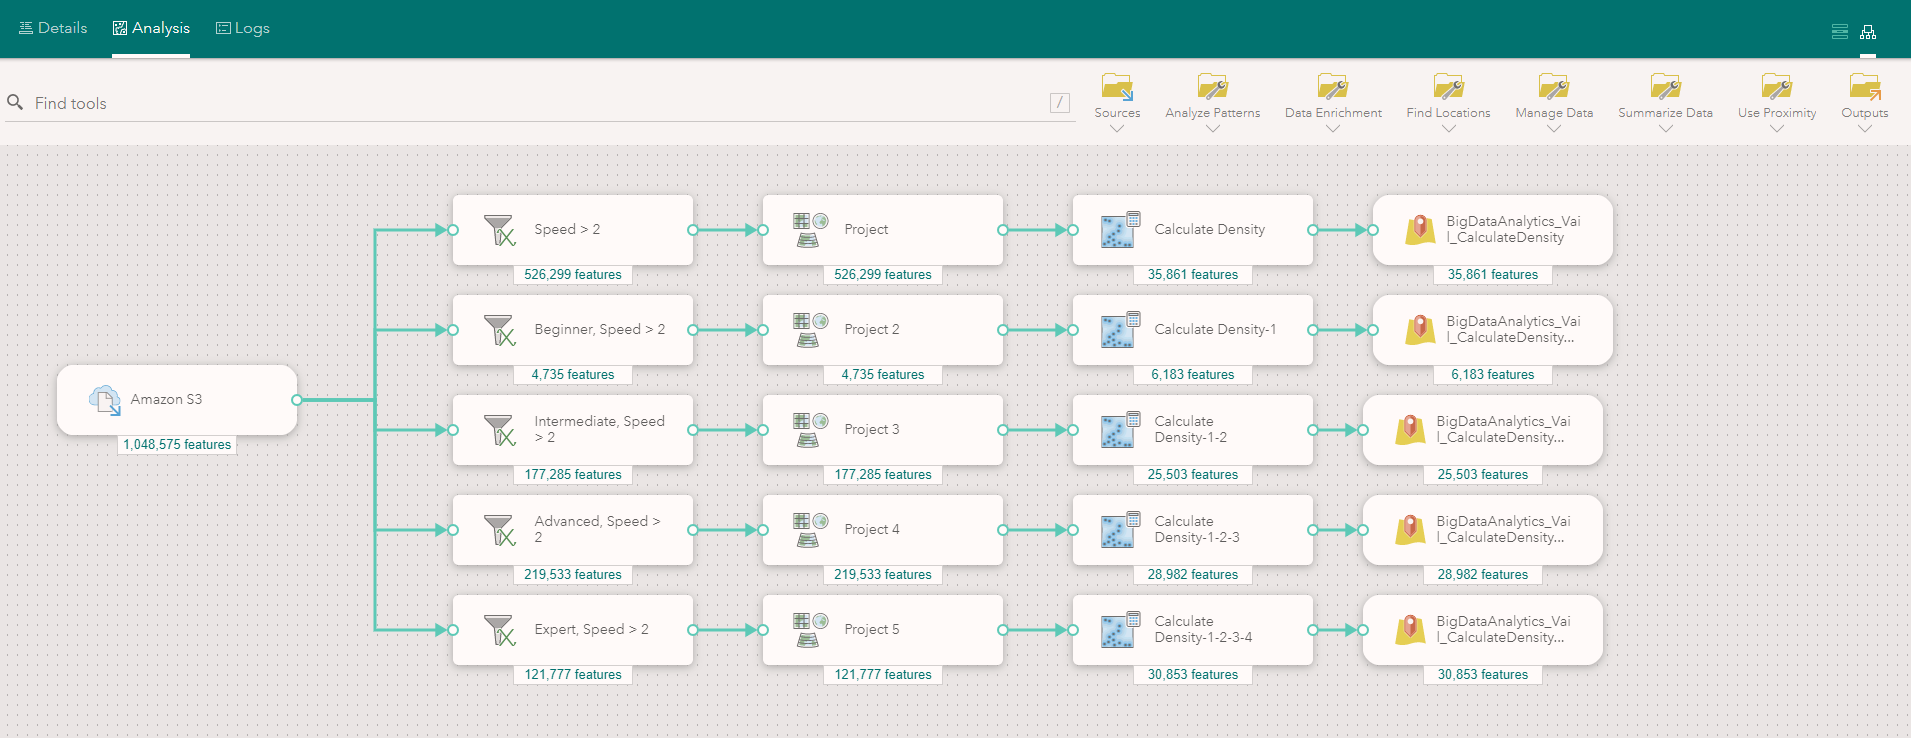
The interfaces in ArcGIS Velocity are incredibly intuitive and easy to use, with workspaces that allow you to add tools and capabilities to your analysis pipeline. One output option is feature layers that are automatically added to the content folder in your ArcGIS Online account, making them available to be added to maps and applications for visualization. Big data analytics can be run on-demand or scheduled to run at specific intervals using the built-in scheduling capability, making sure that your information products are kept up to date as new data gets added to the system.

Learning Velocity
Esri offers some great resources to help new users get started with ArcGIS Velocity. Working through the Get Started with ArcGIS Velocity discovery path is a good place to start; this resource includes articles, videos, and tutorials that will walk you through creating feeds, enhancing feeds with real-time analytics, and creating a big data analytic. From there, you can also find videos and presentations on ArcGIS Velocity on YouTube and dig into the official documentation to learn more about ingesting data from feeds, performing analysis and creating outputs, and more.