


Do you ever wish you could just make the updates to your maps and everyone has access to it? Whether it’s downloading the shapefile or viewing the map itself? With ArcGIS Online all this is possible! In your ArcGIS Online account, you can create a custom interactive map for others to search, view, and even export your data all on their own. No more emails or searching through your file folders trying to find the most current PDF. In this article, we are going to go over a recent project we did for a client who wanted a different workflow to make life a little easier. City of Goodlettsville sent over PDFs that needed to be covered digitally along with a shapefile for the zoning boundary. With revisions, we were able to configure an interactive map that would allow the public to view and export the most current zoning data.
PDF to ArcGIS Online (AGOL)
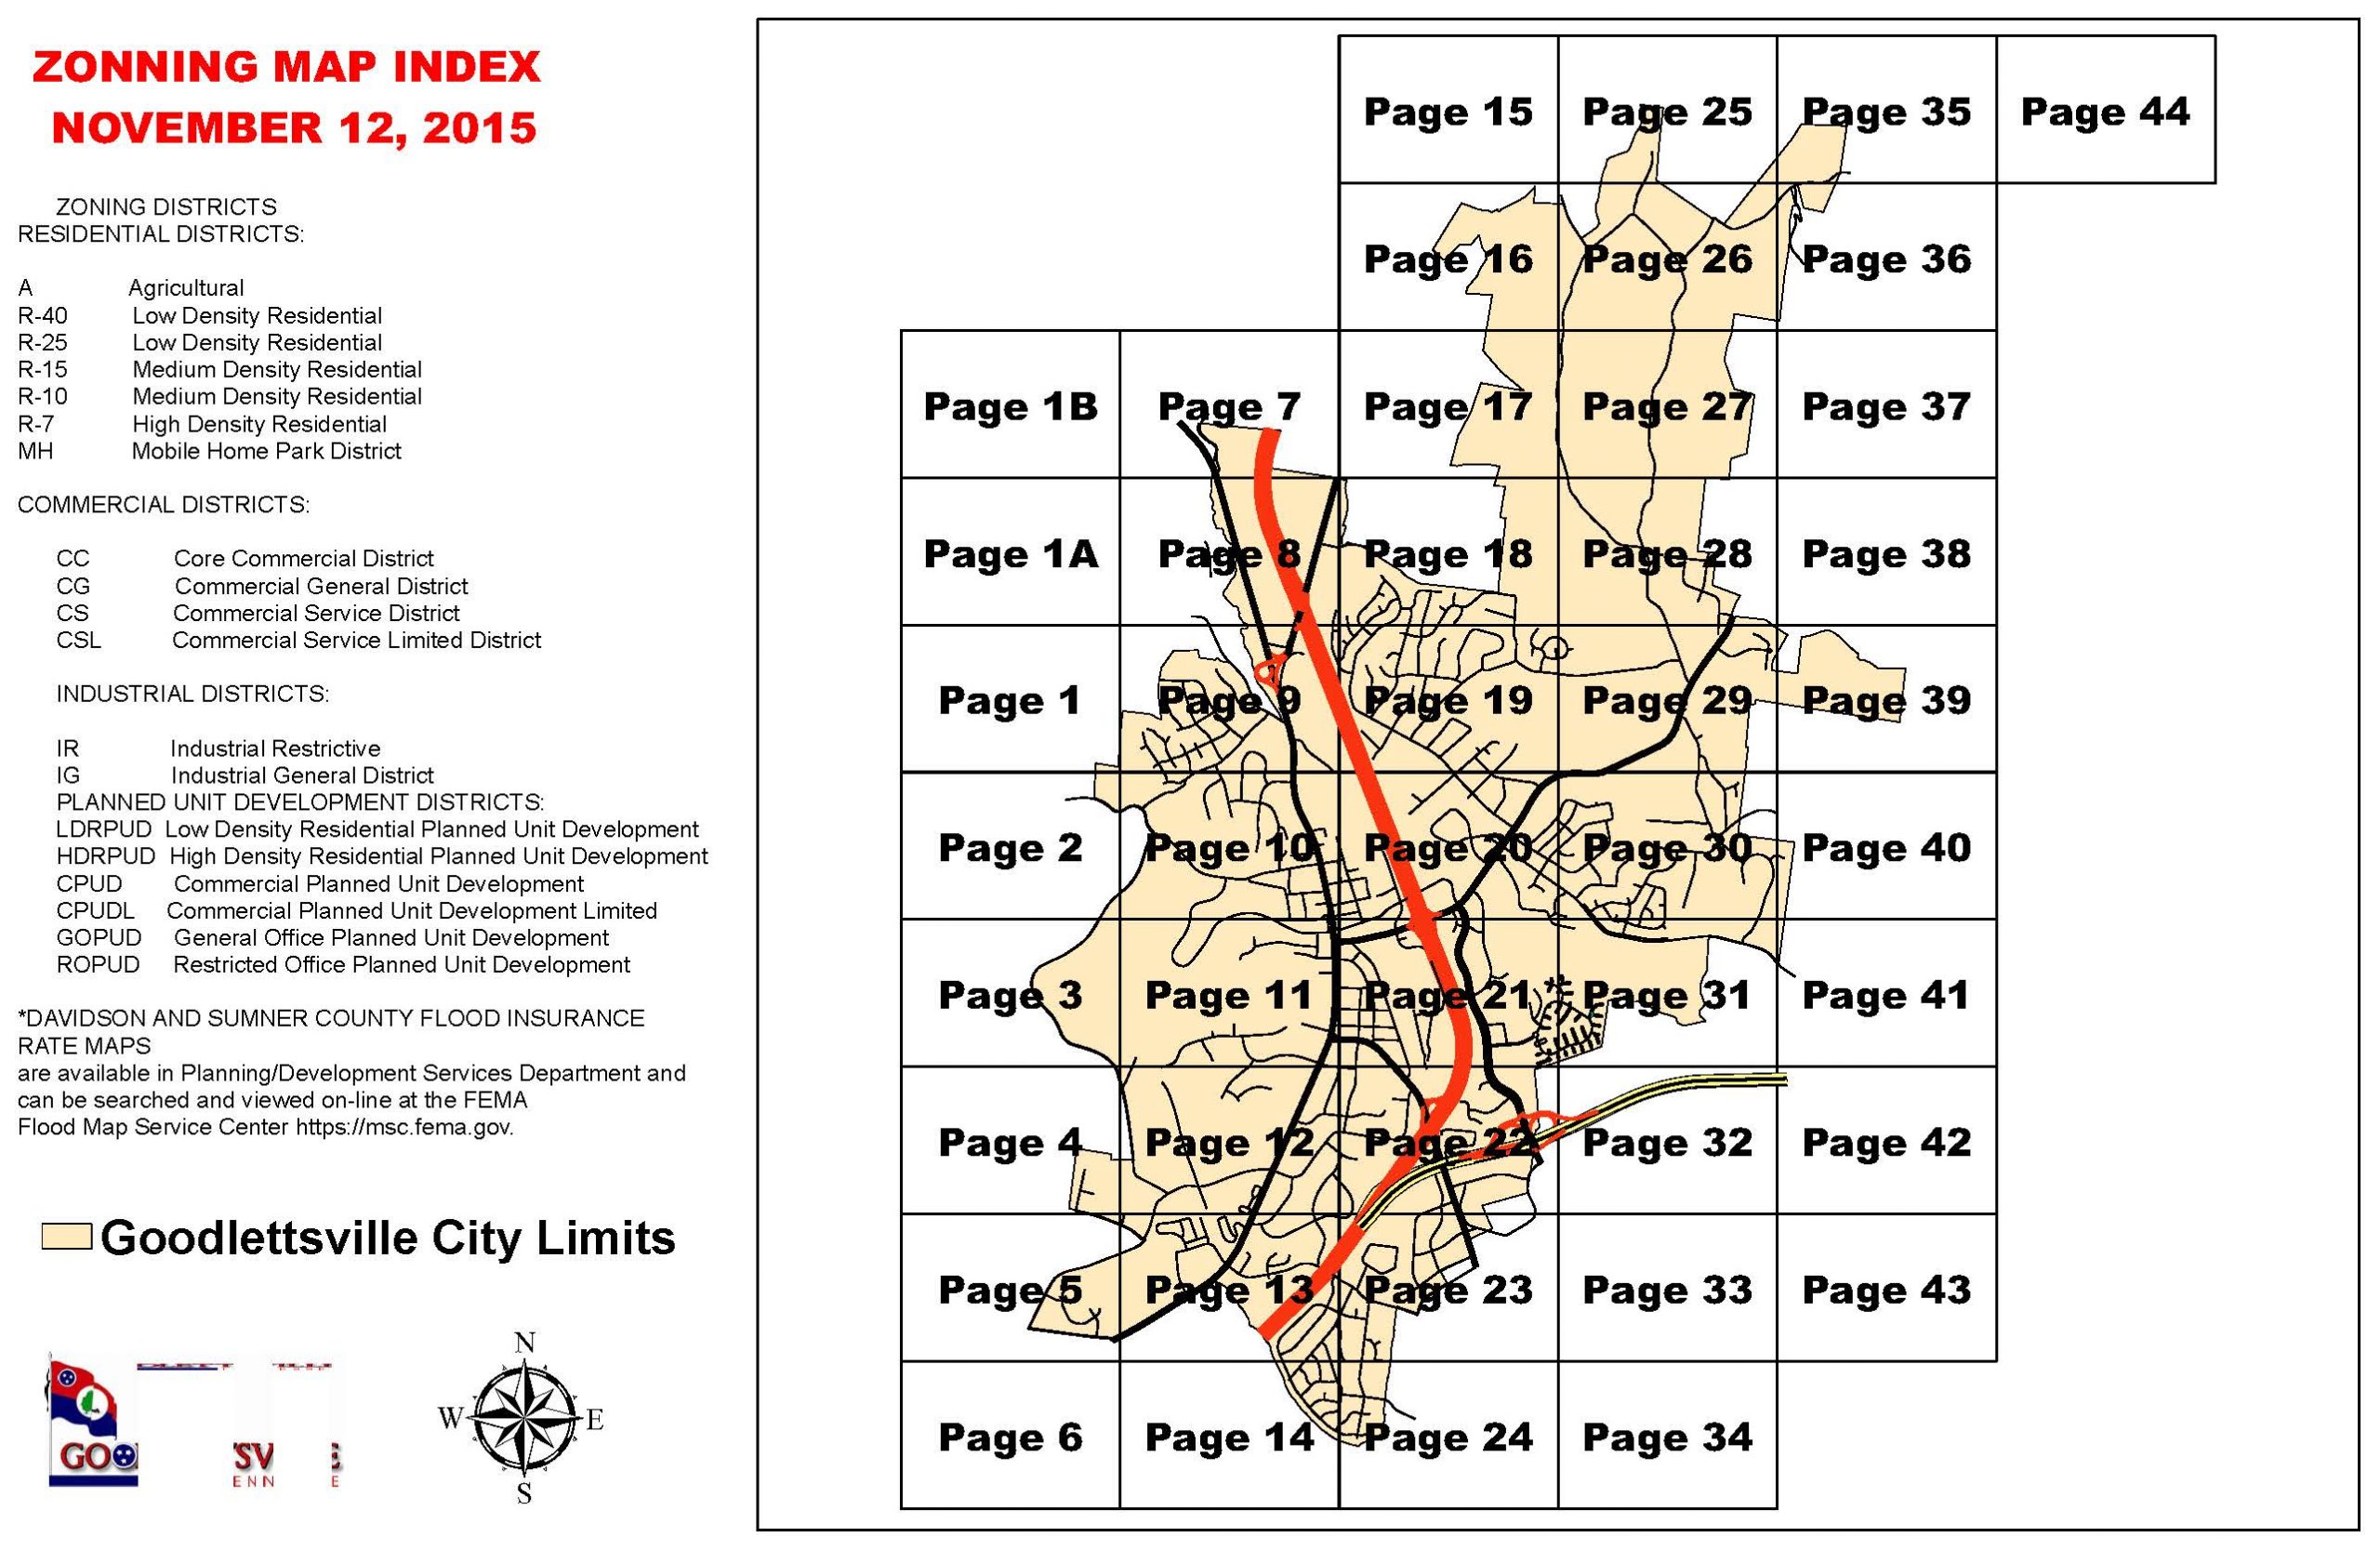
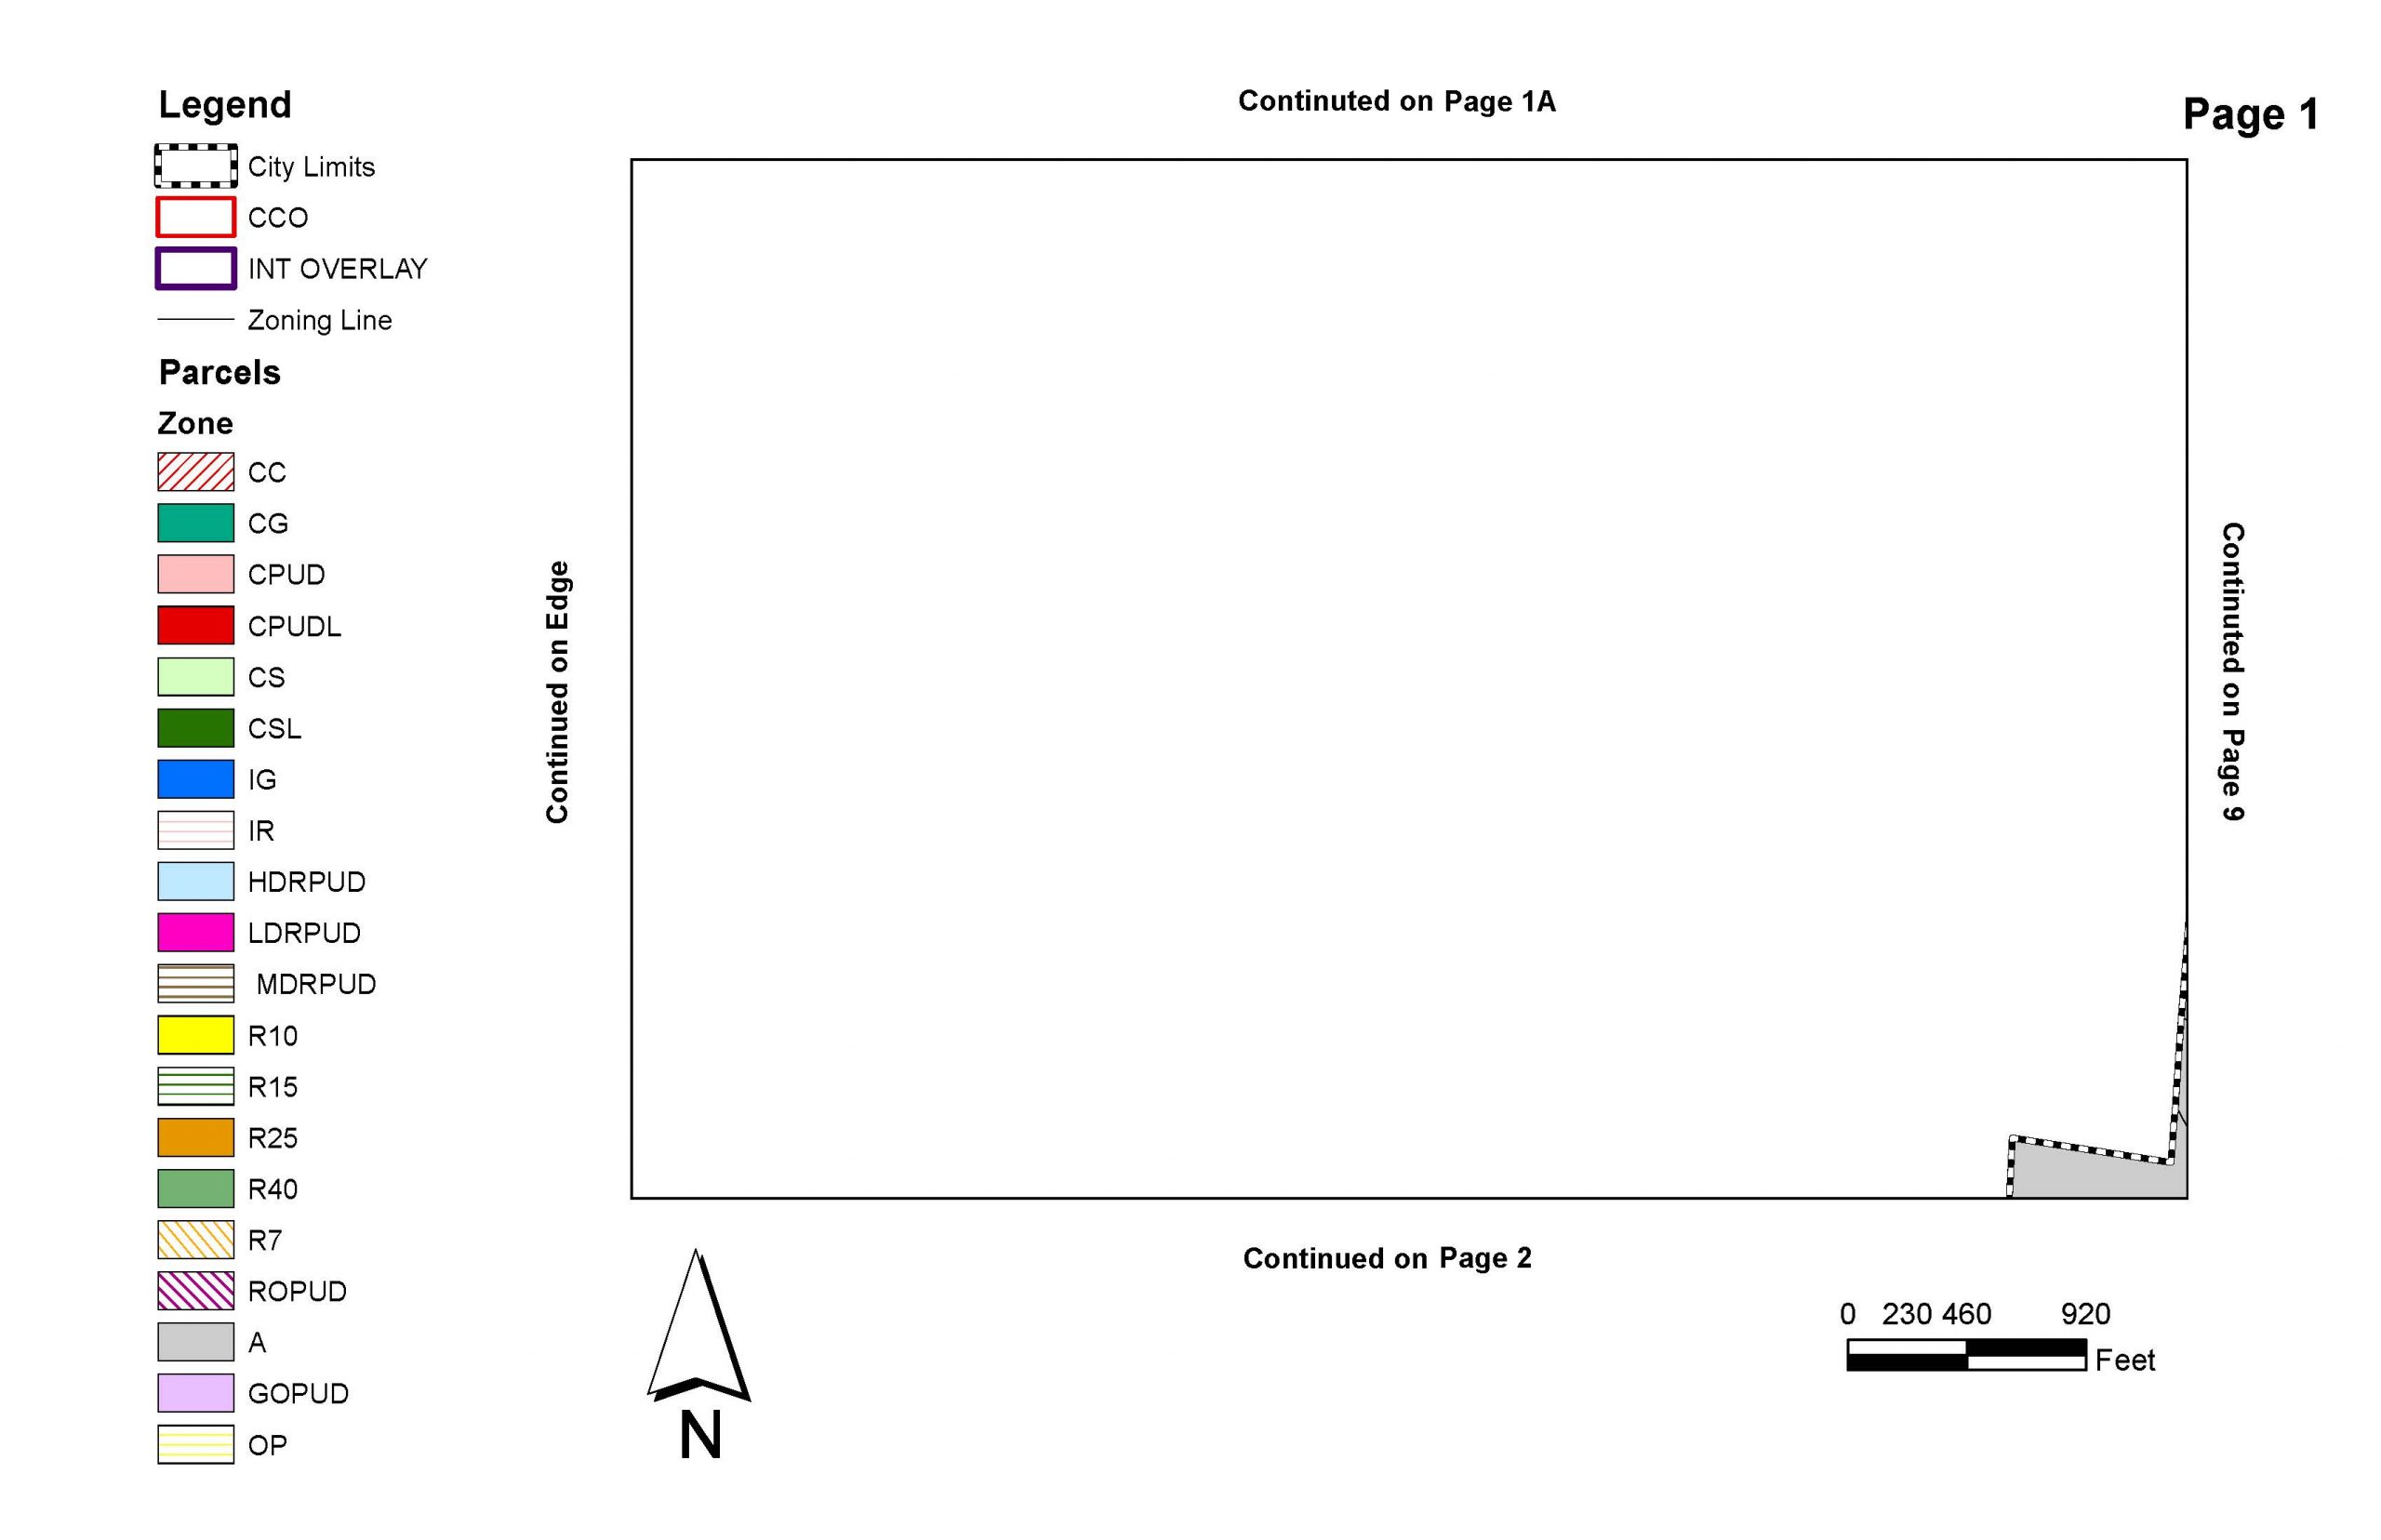
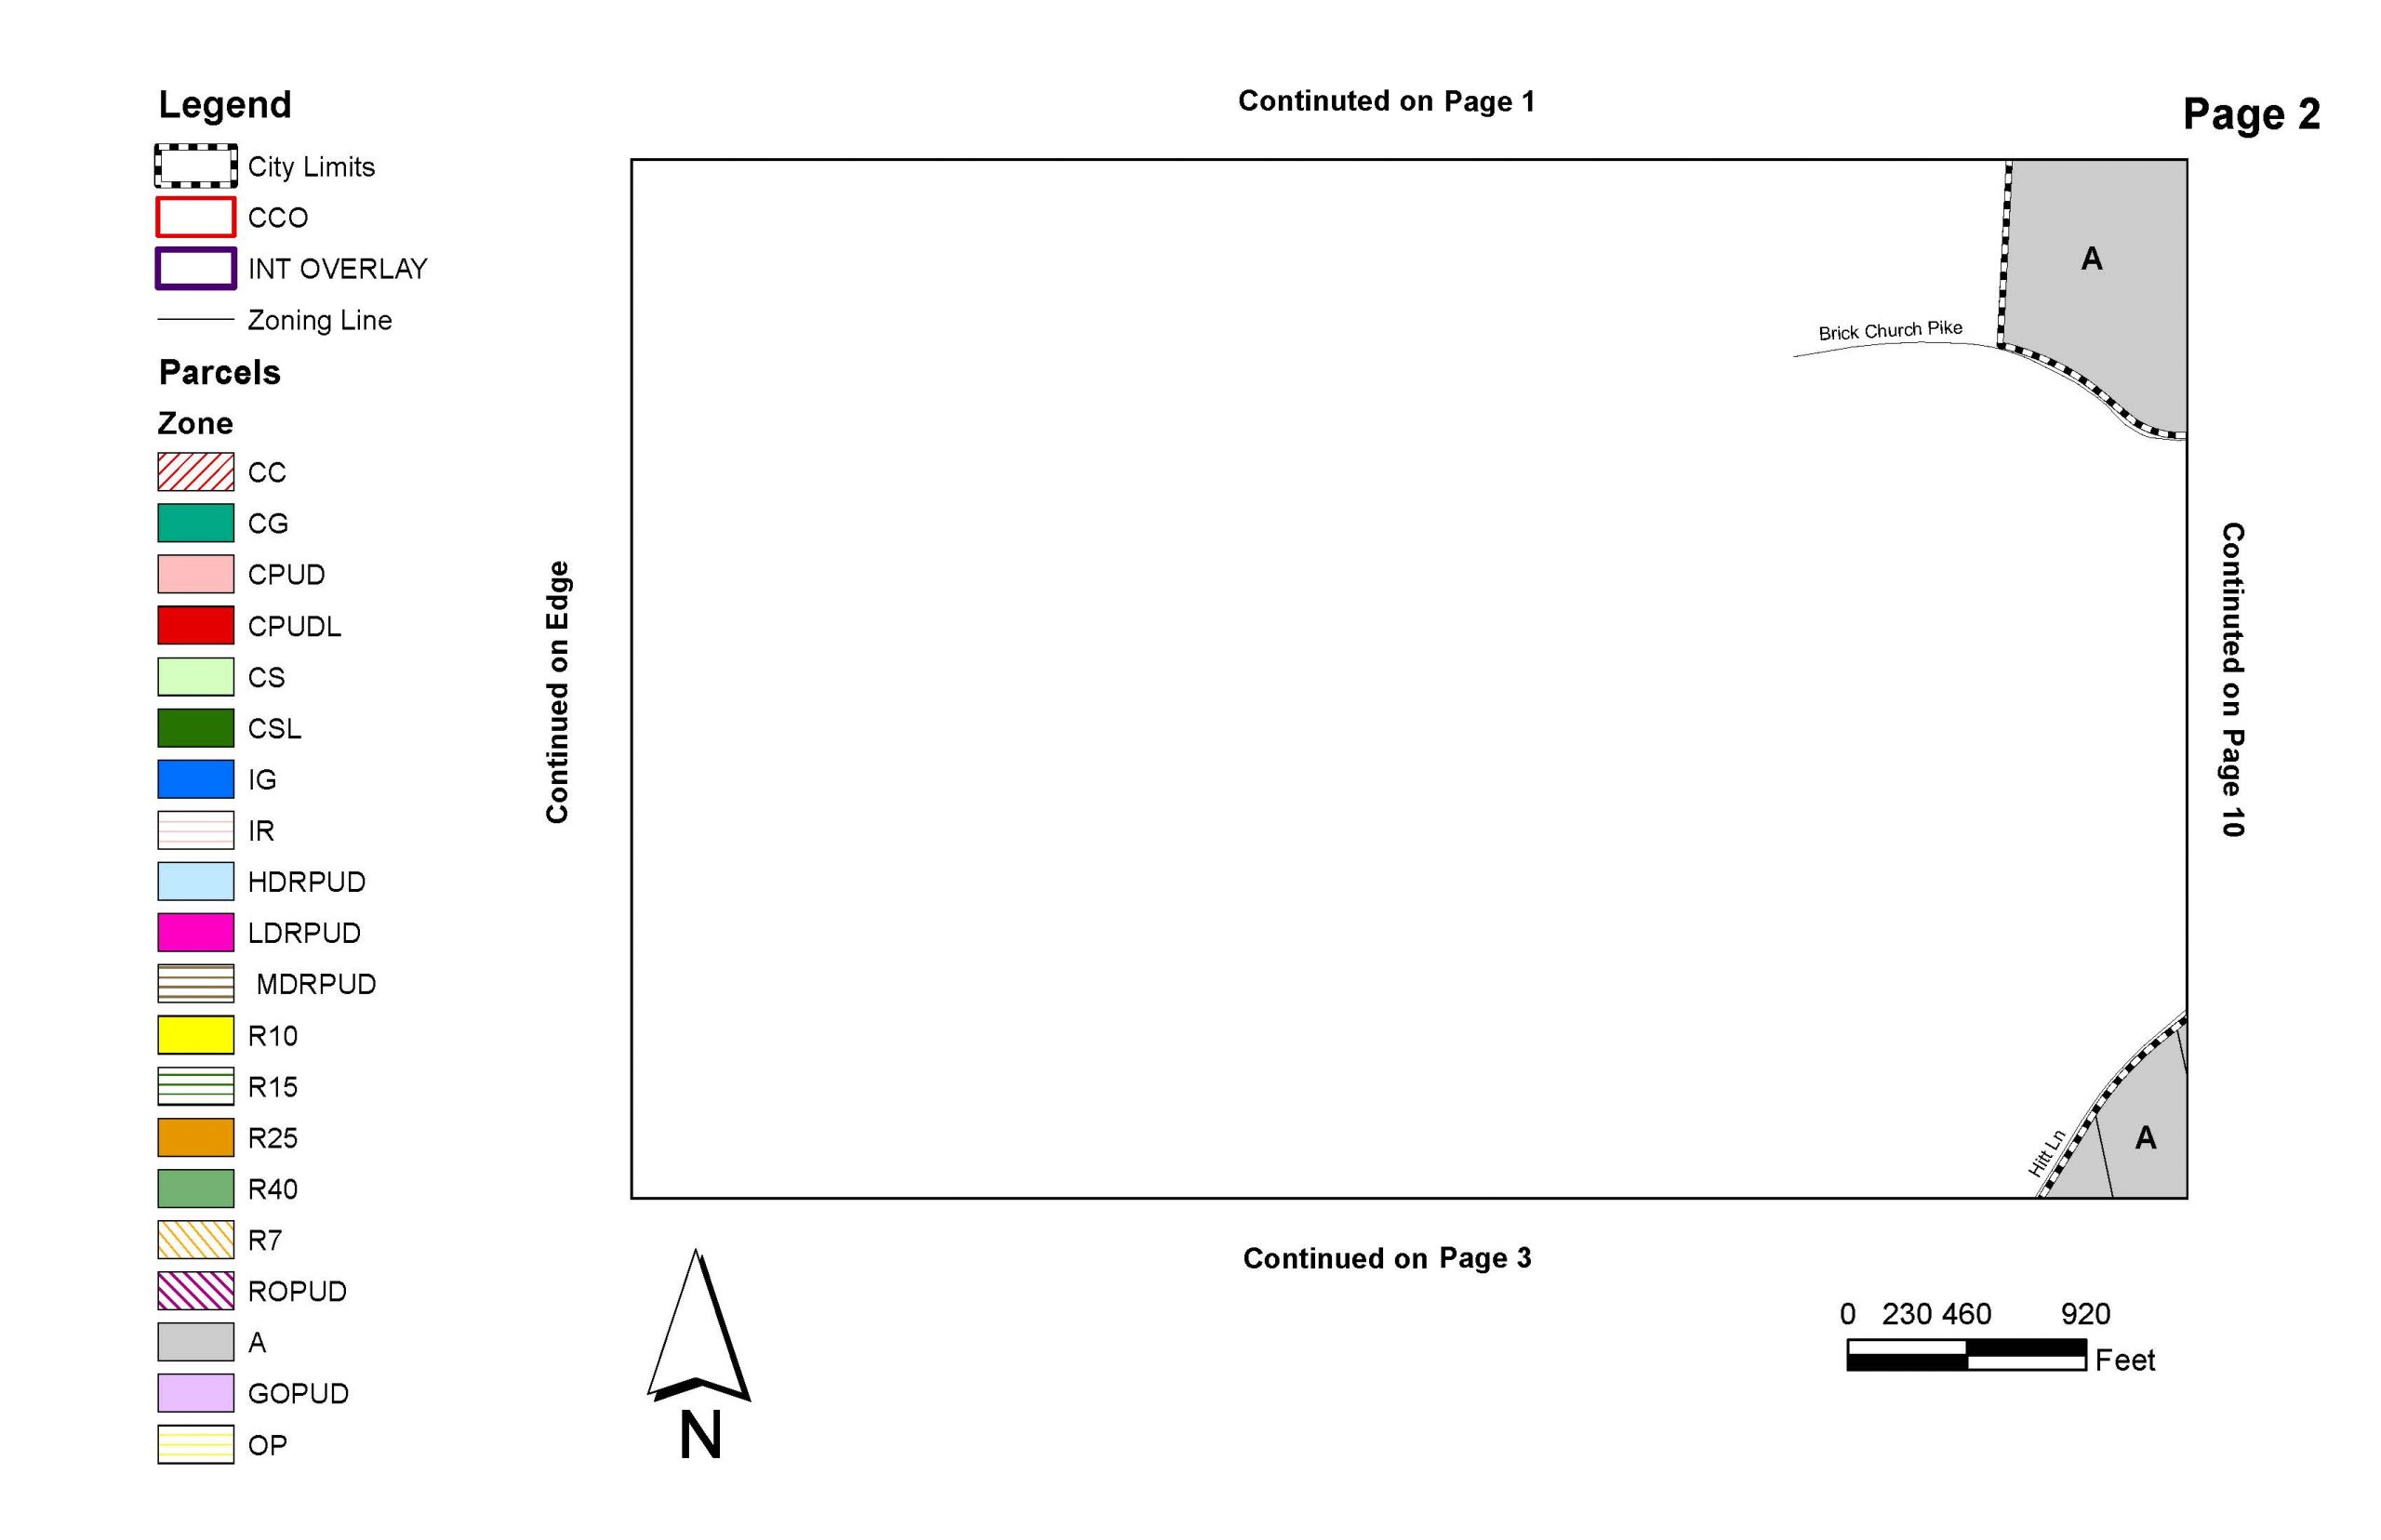
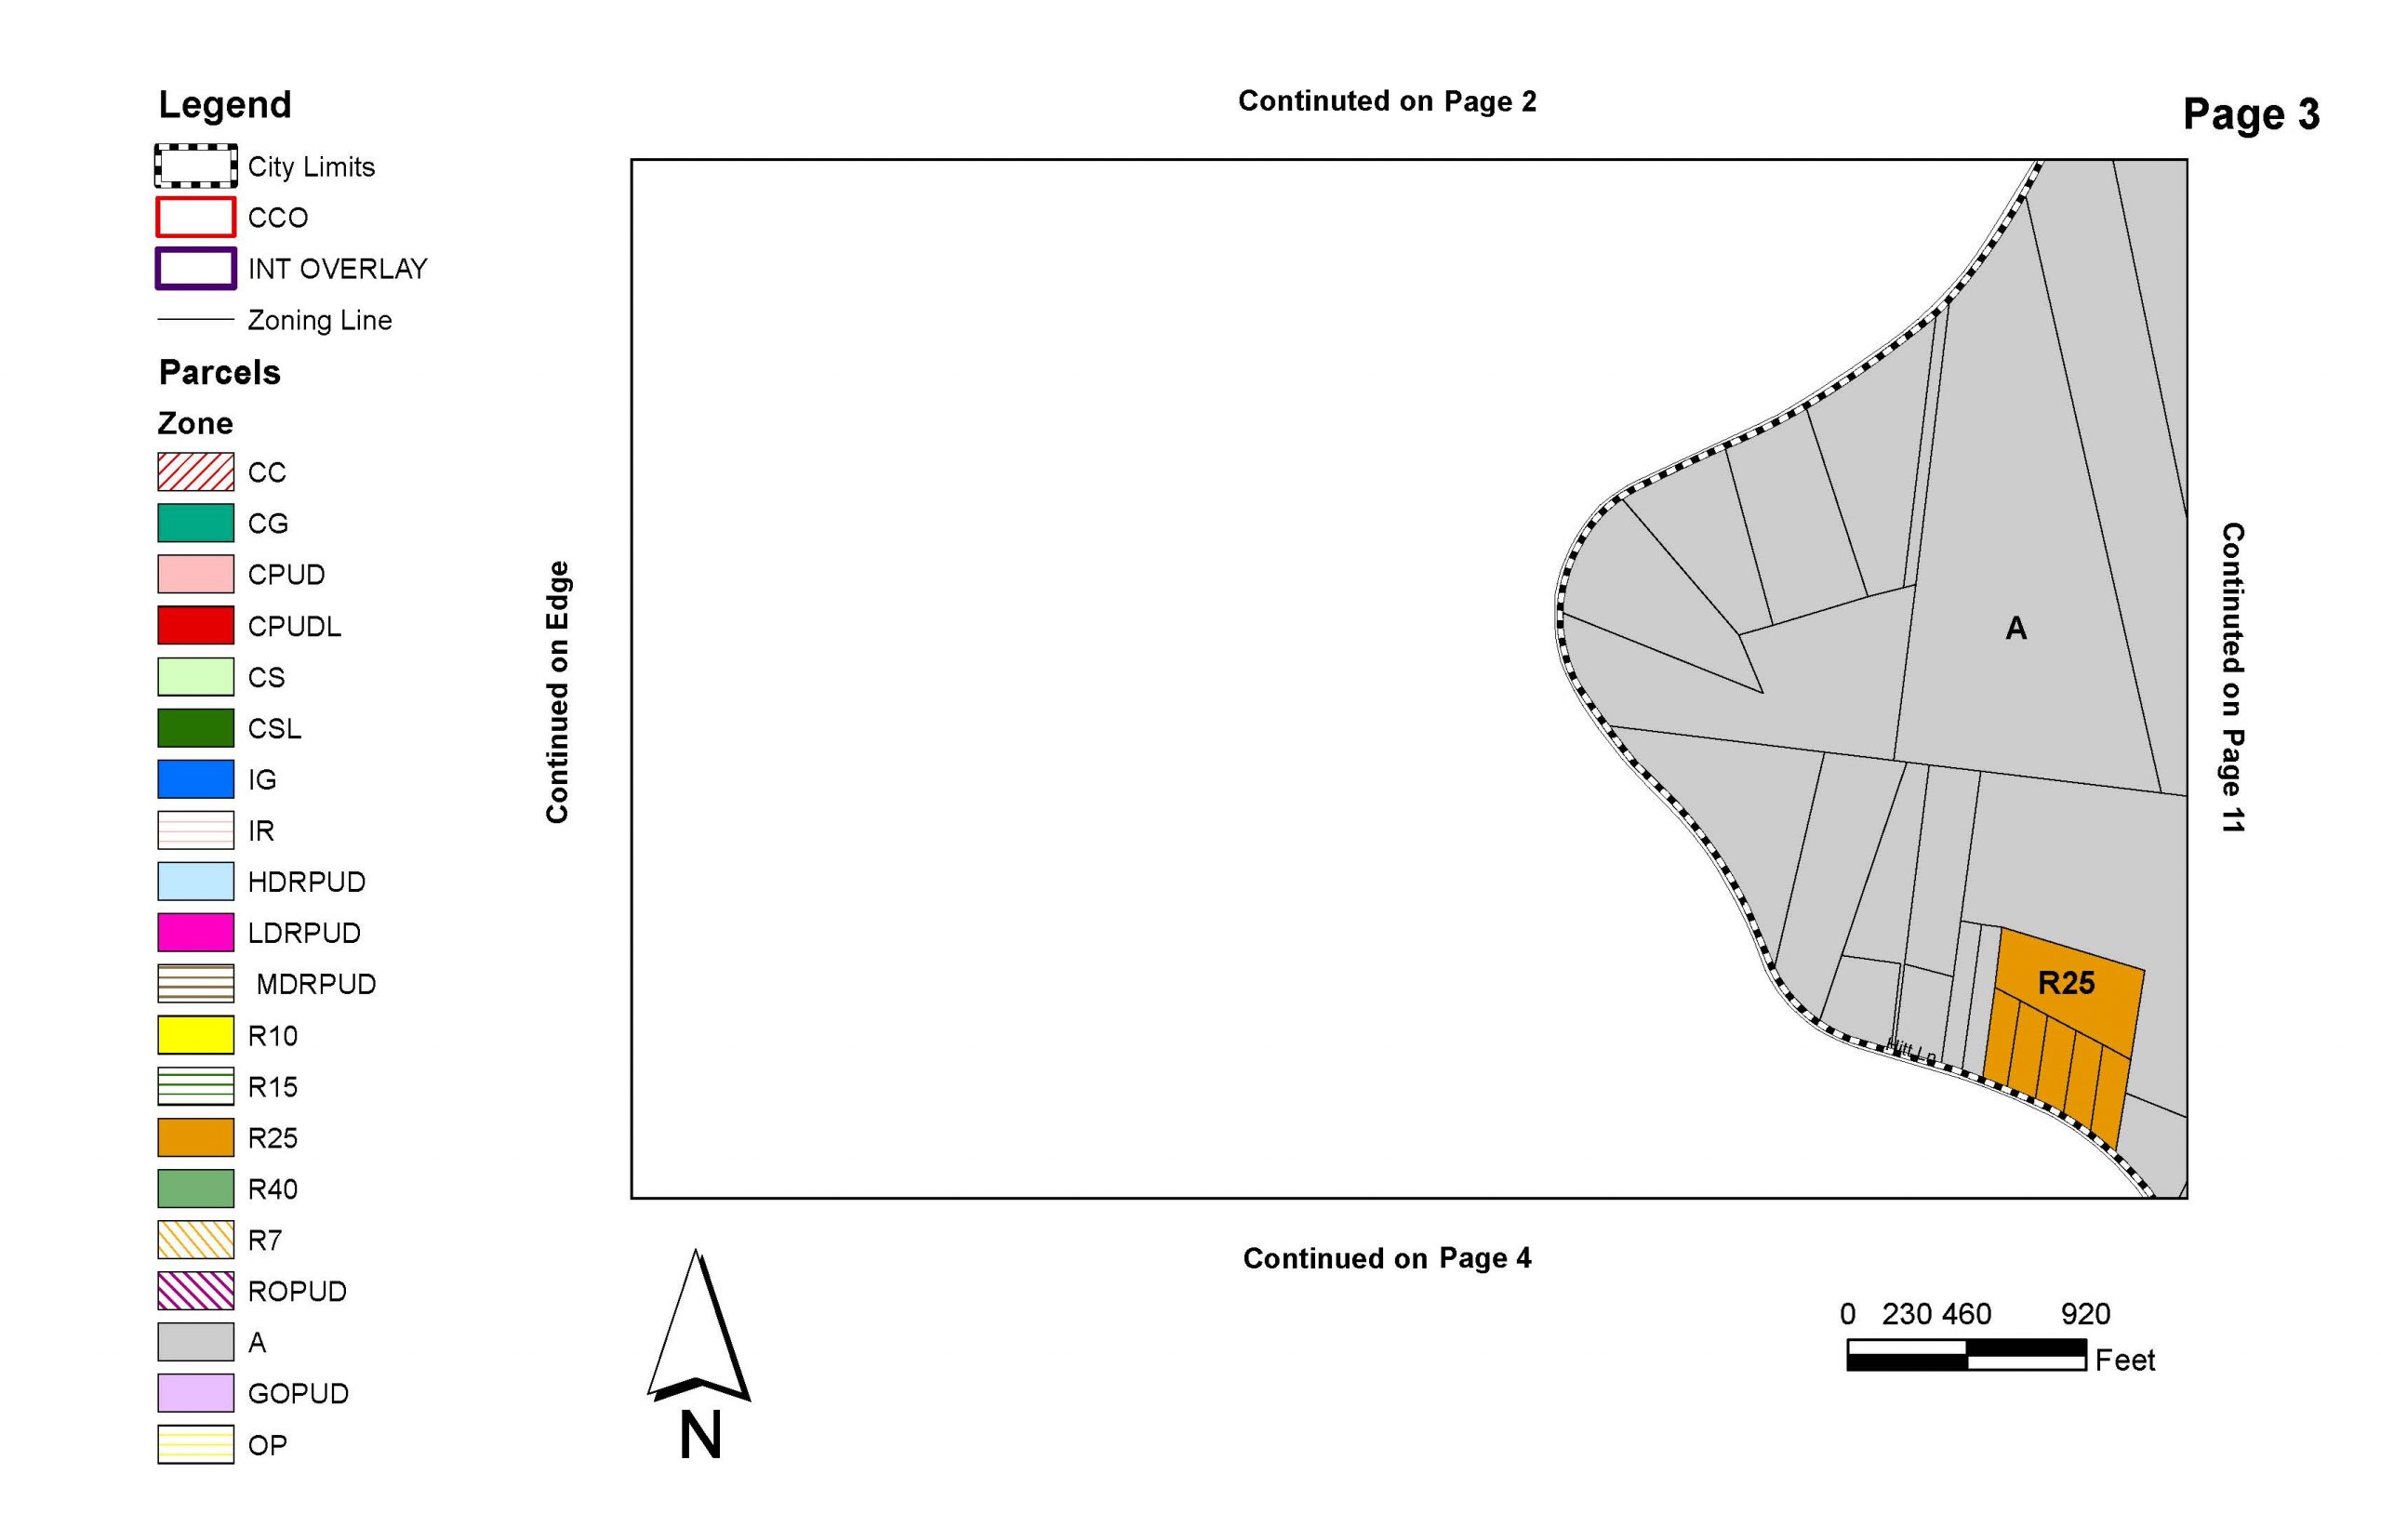
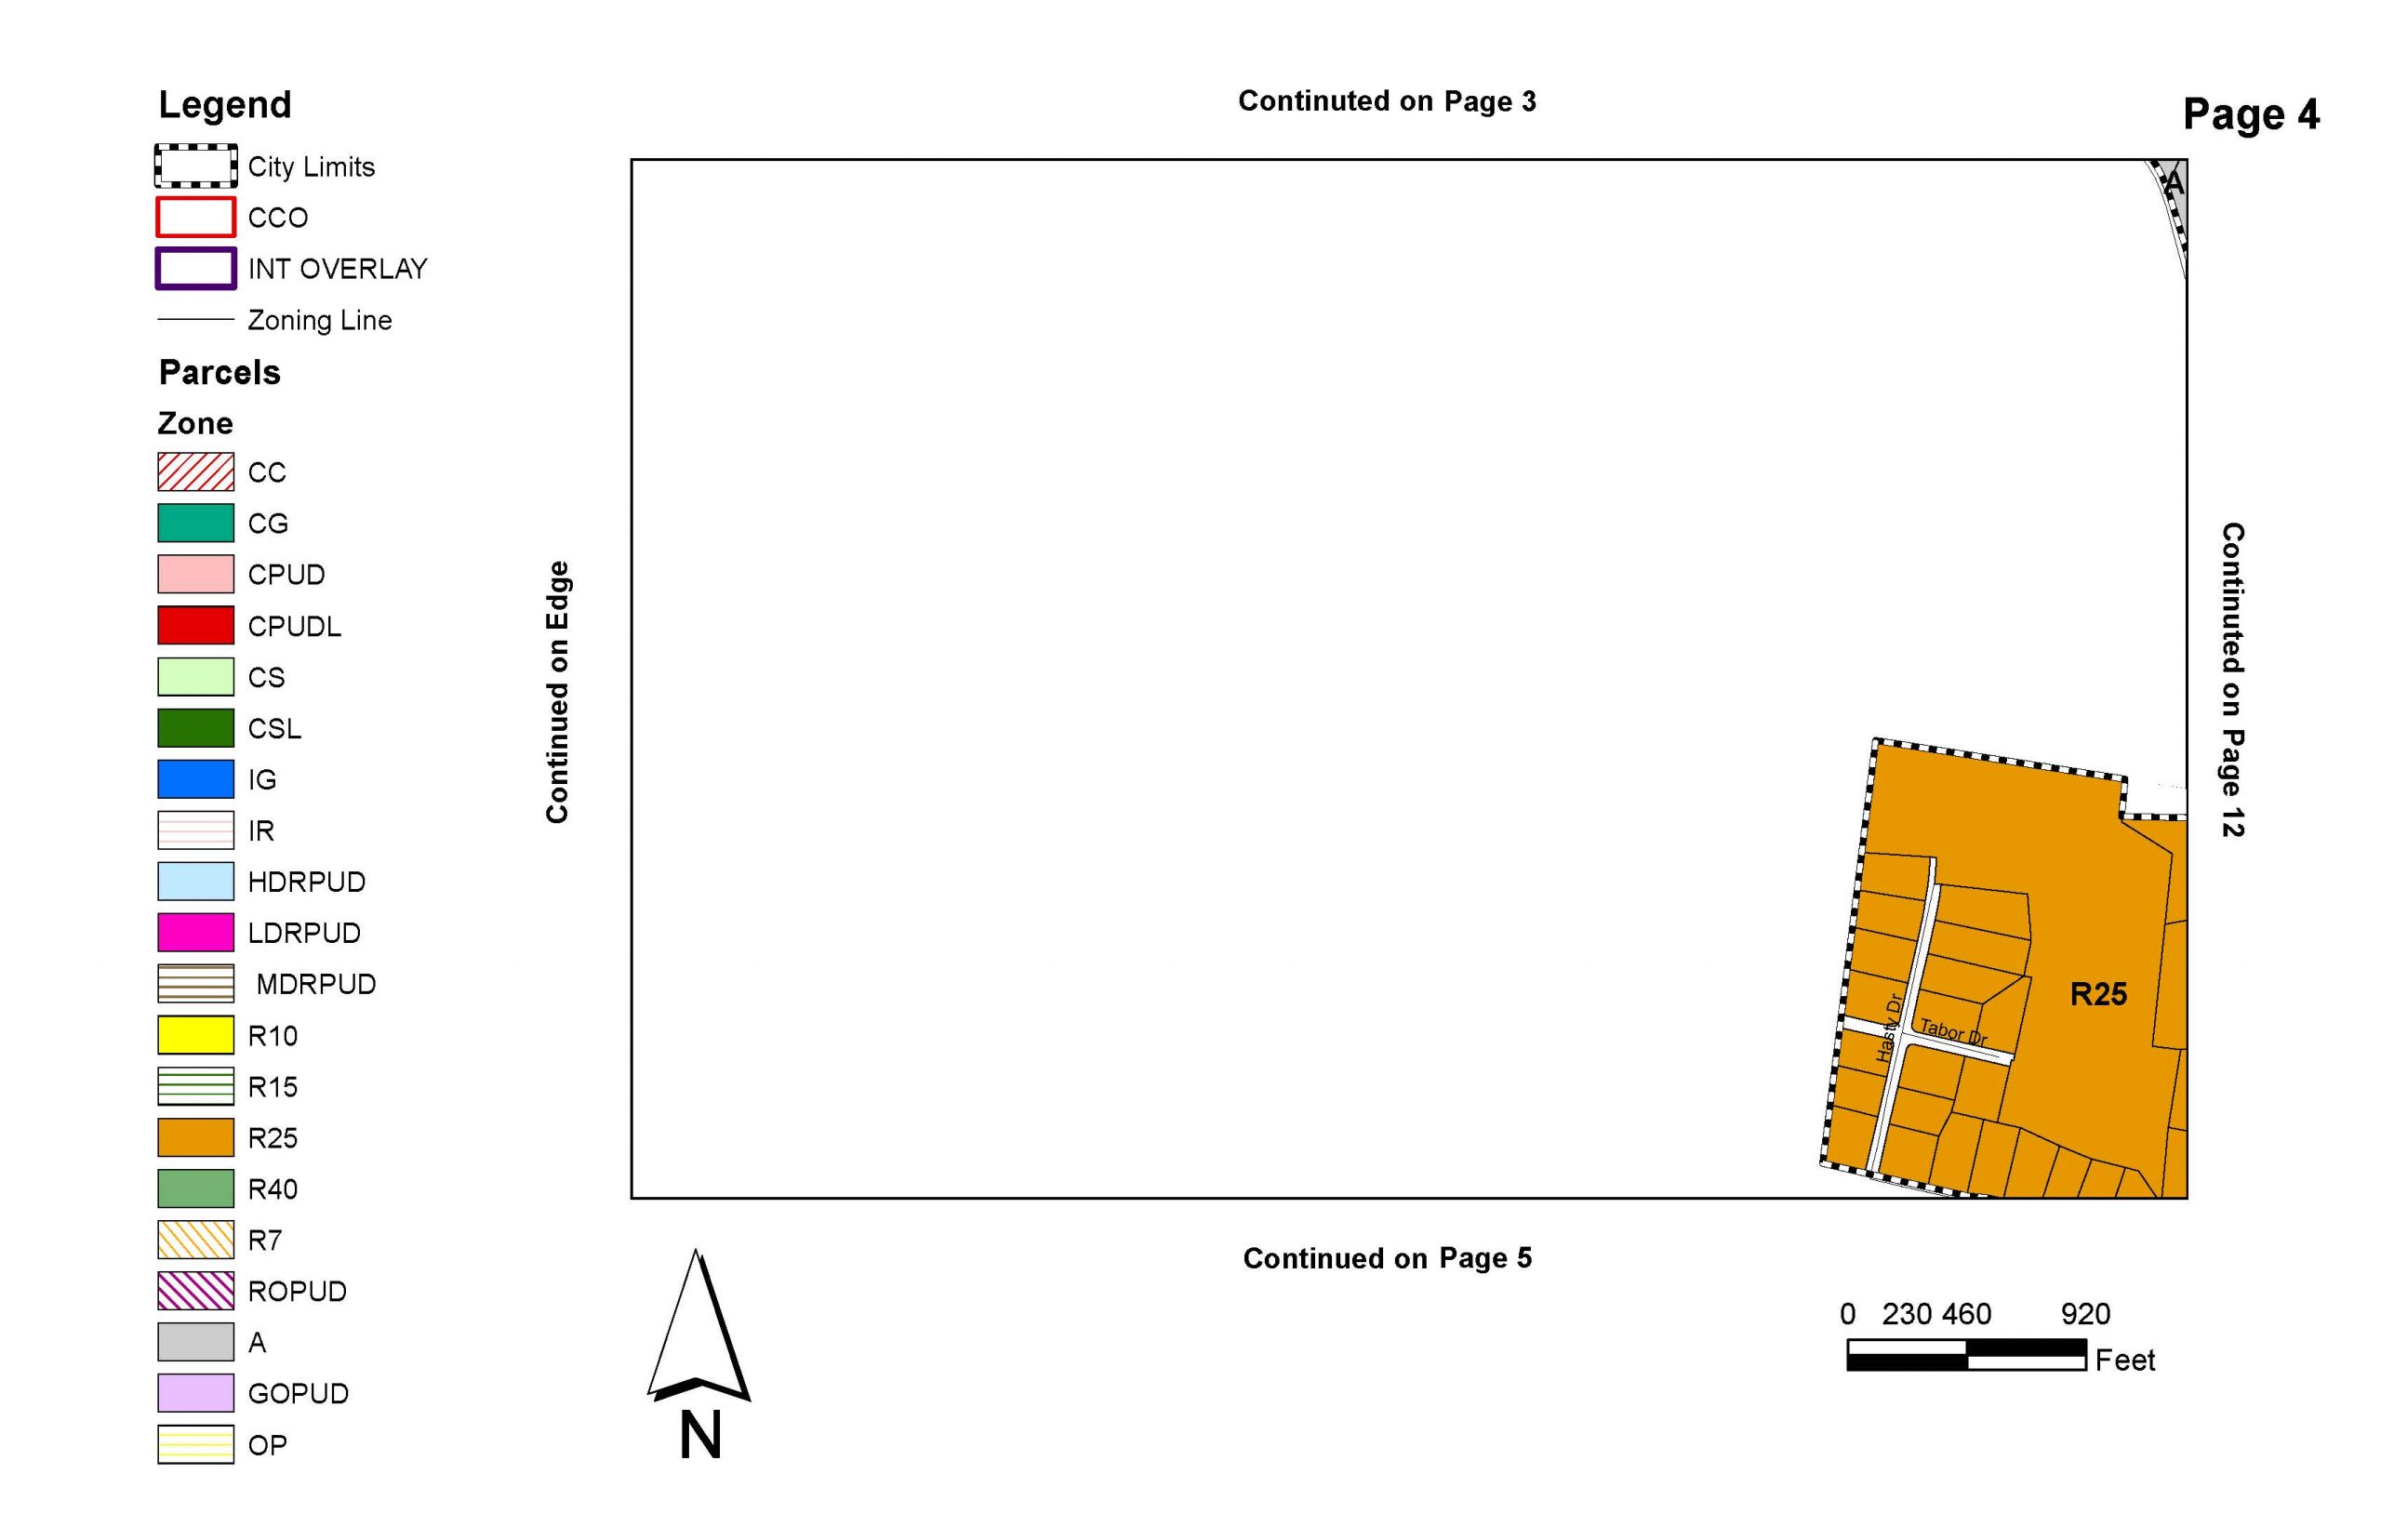
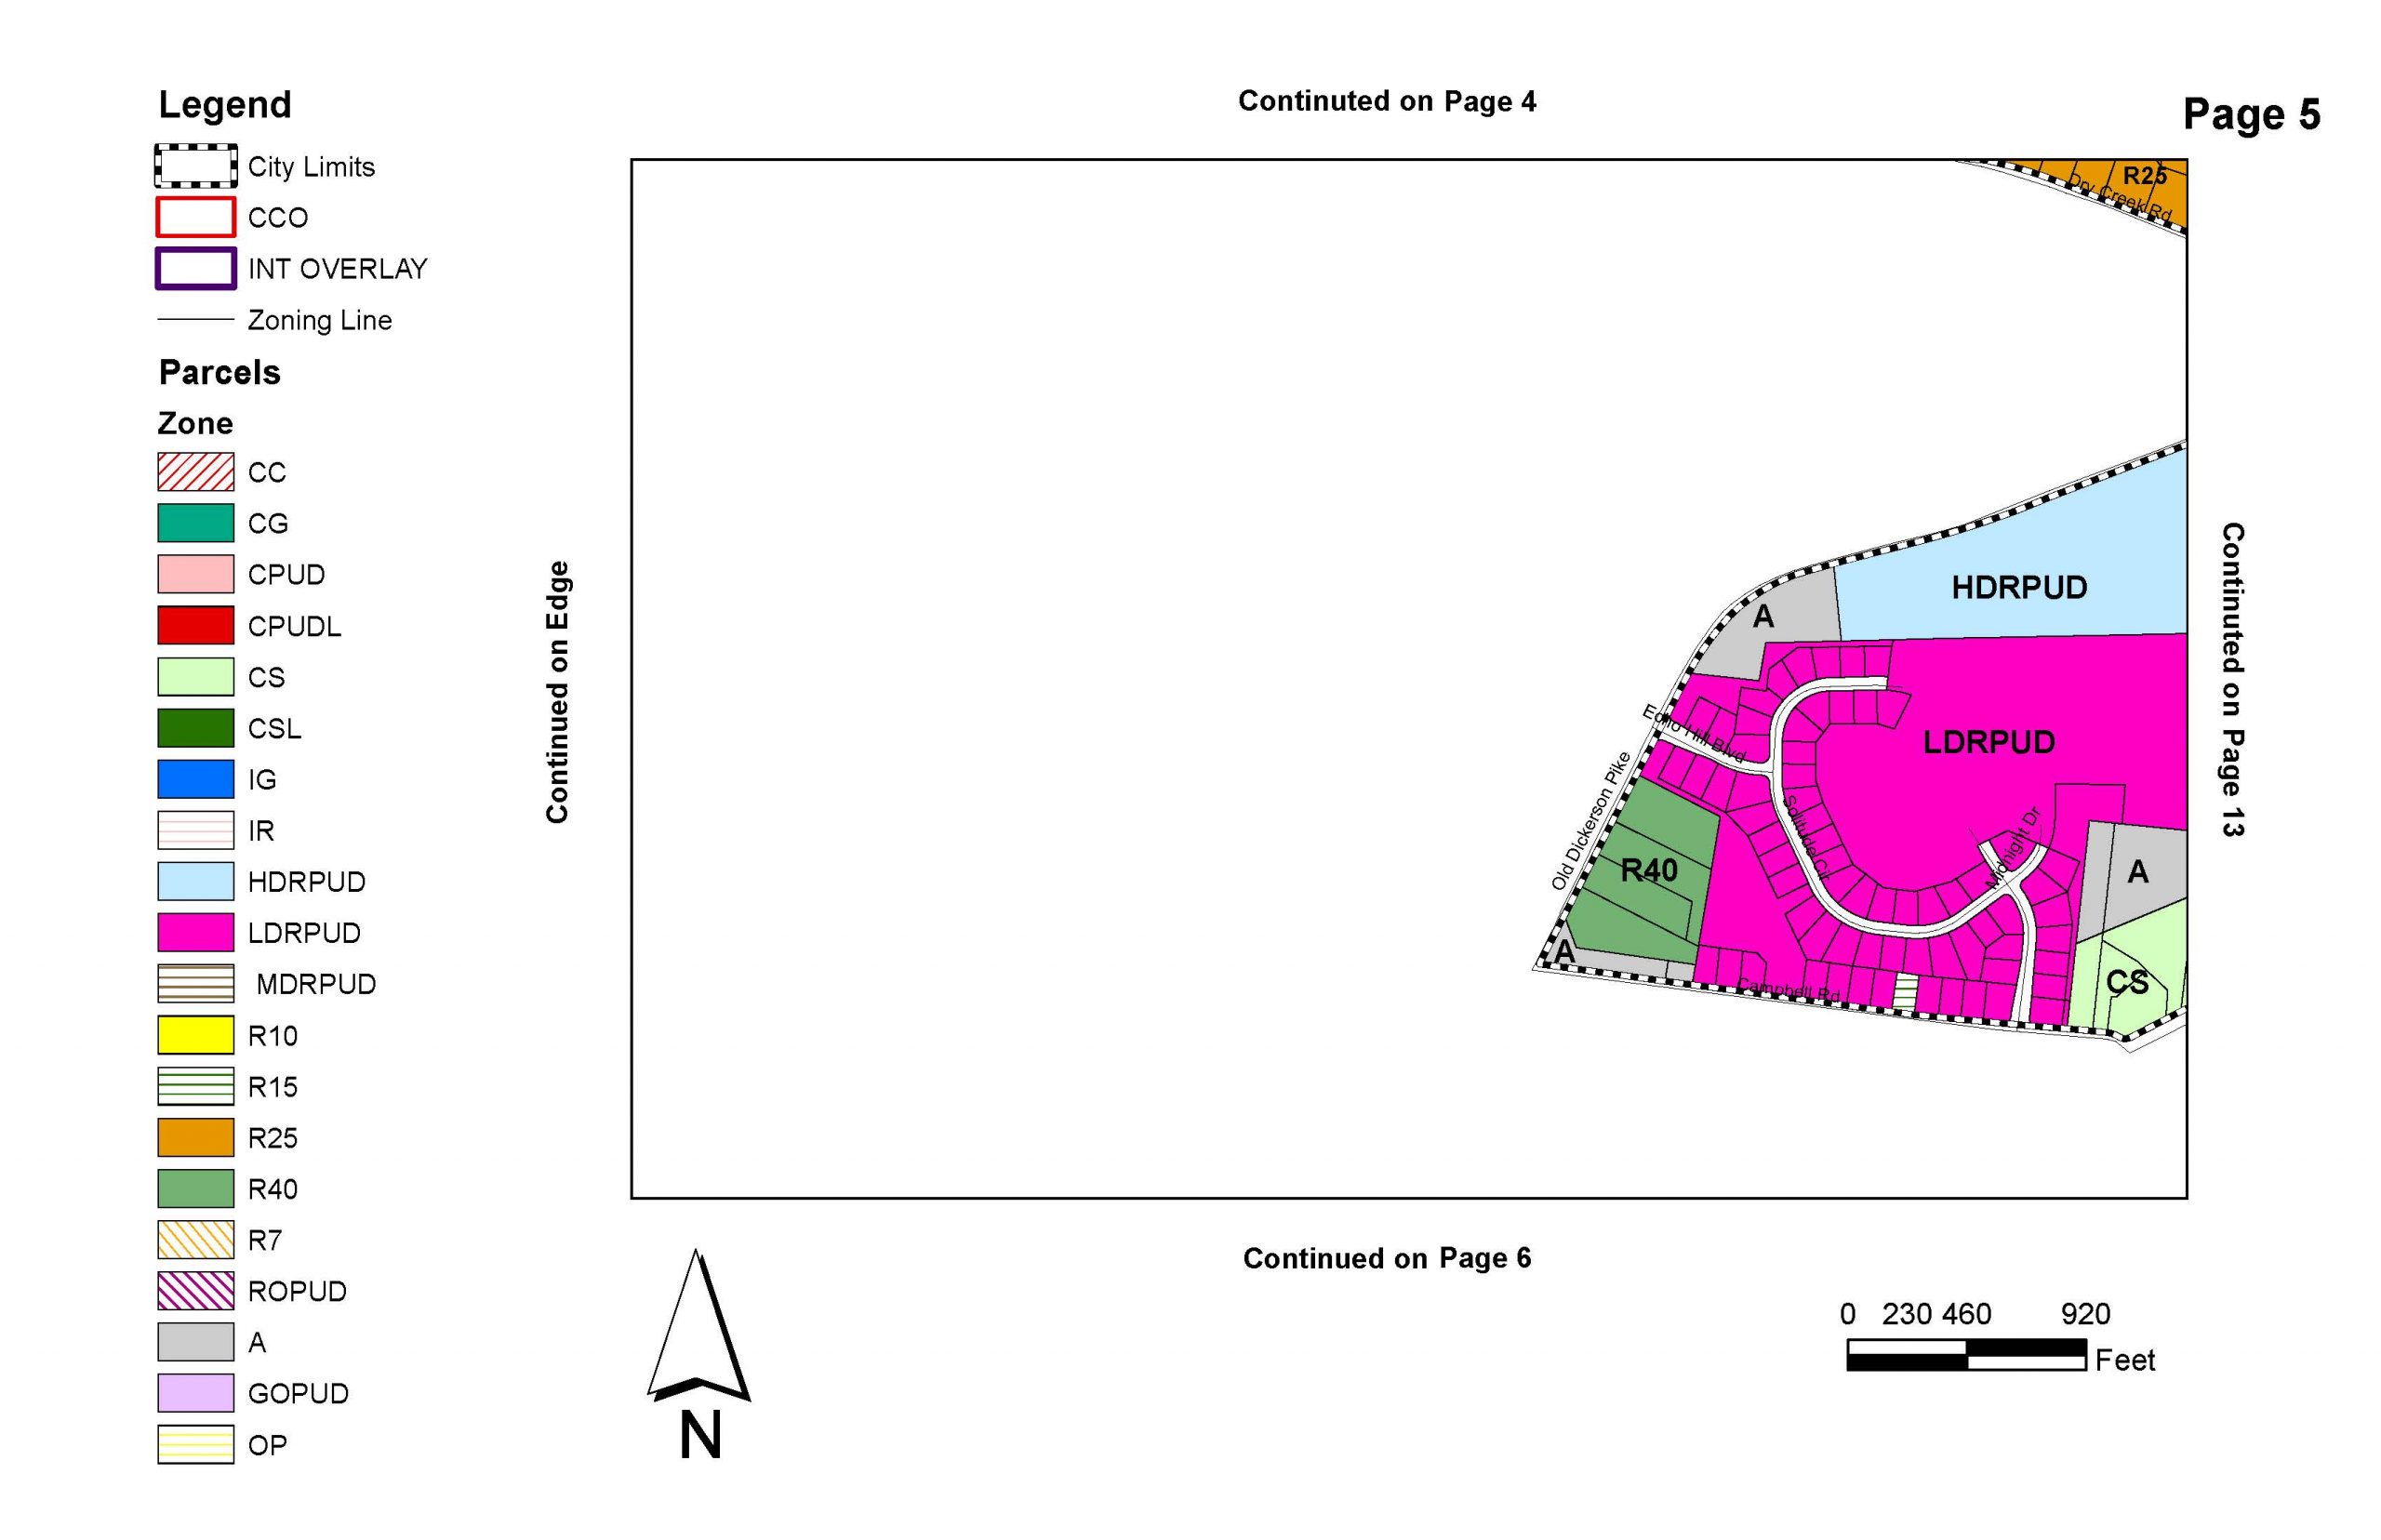
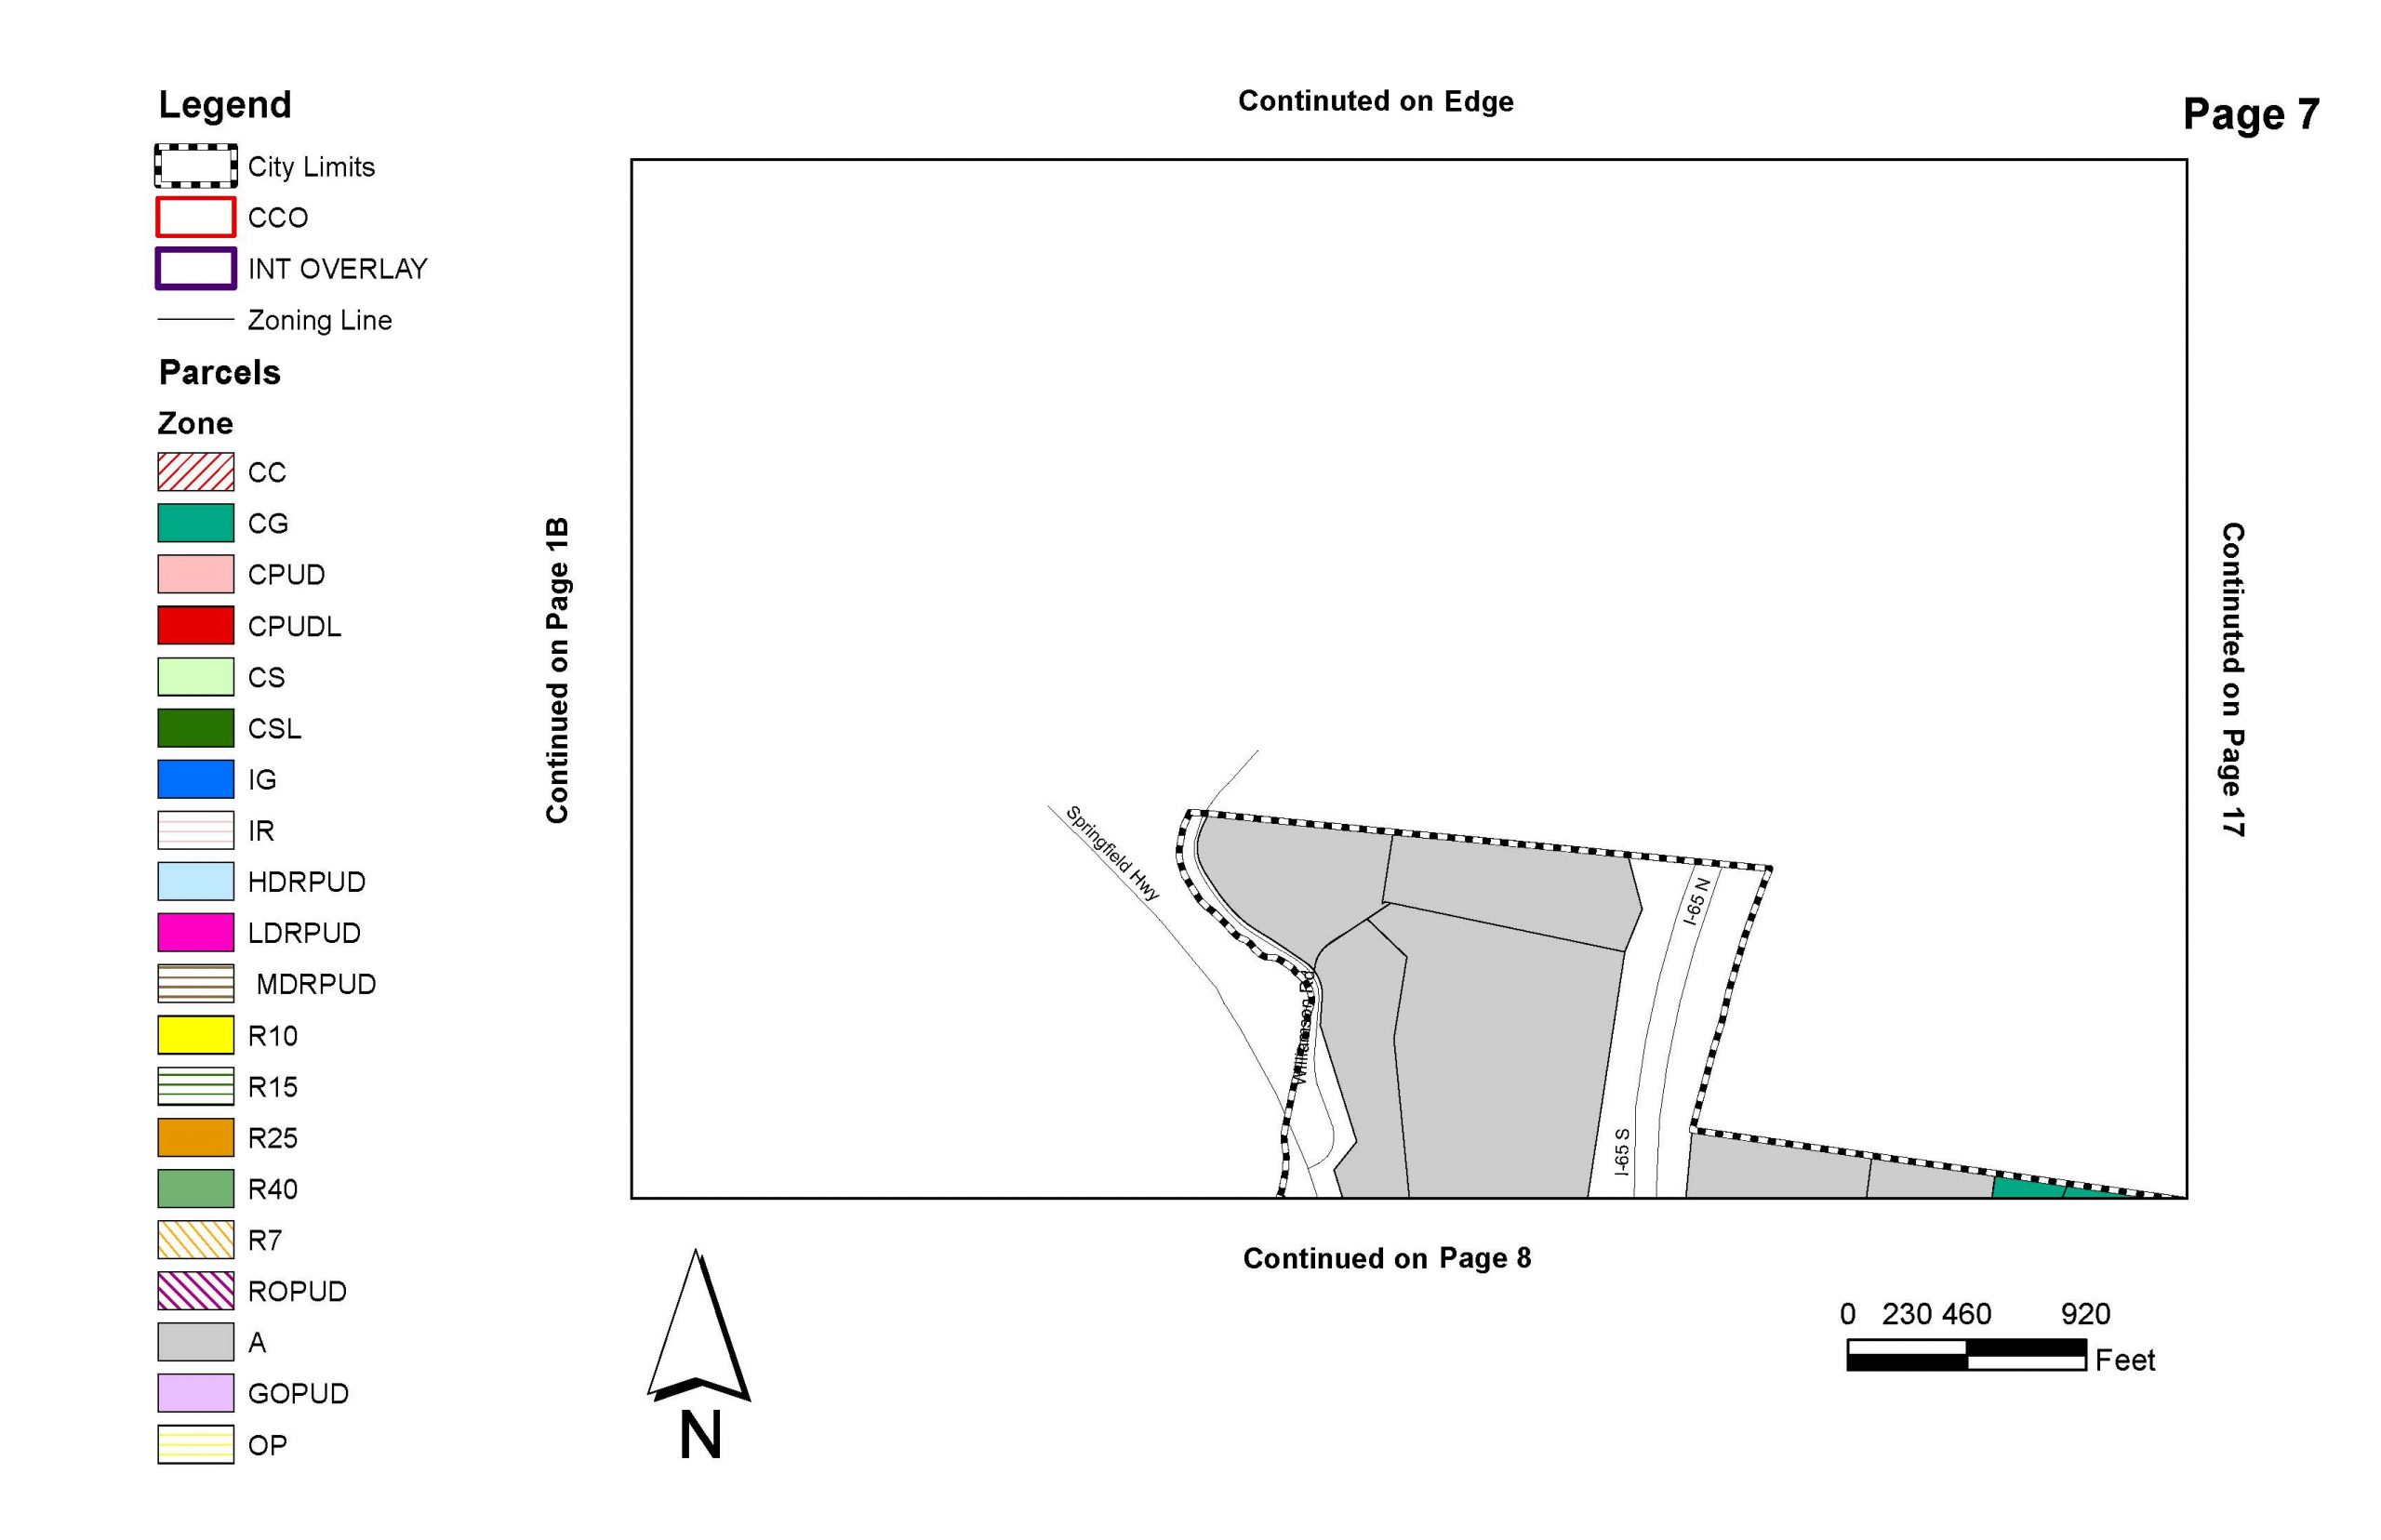
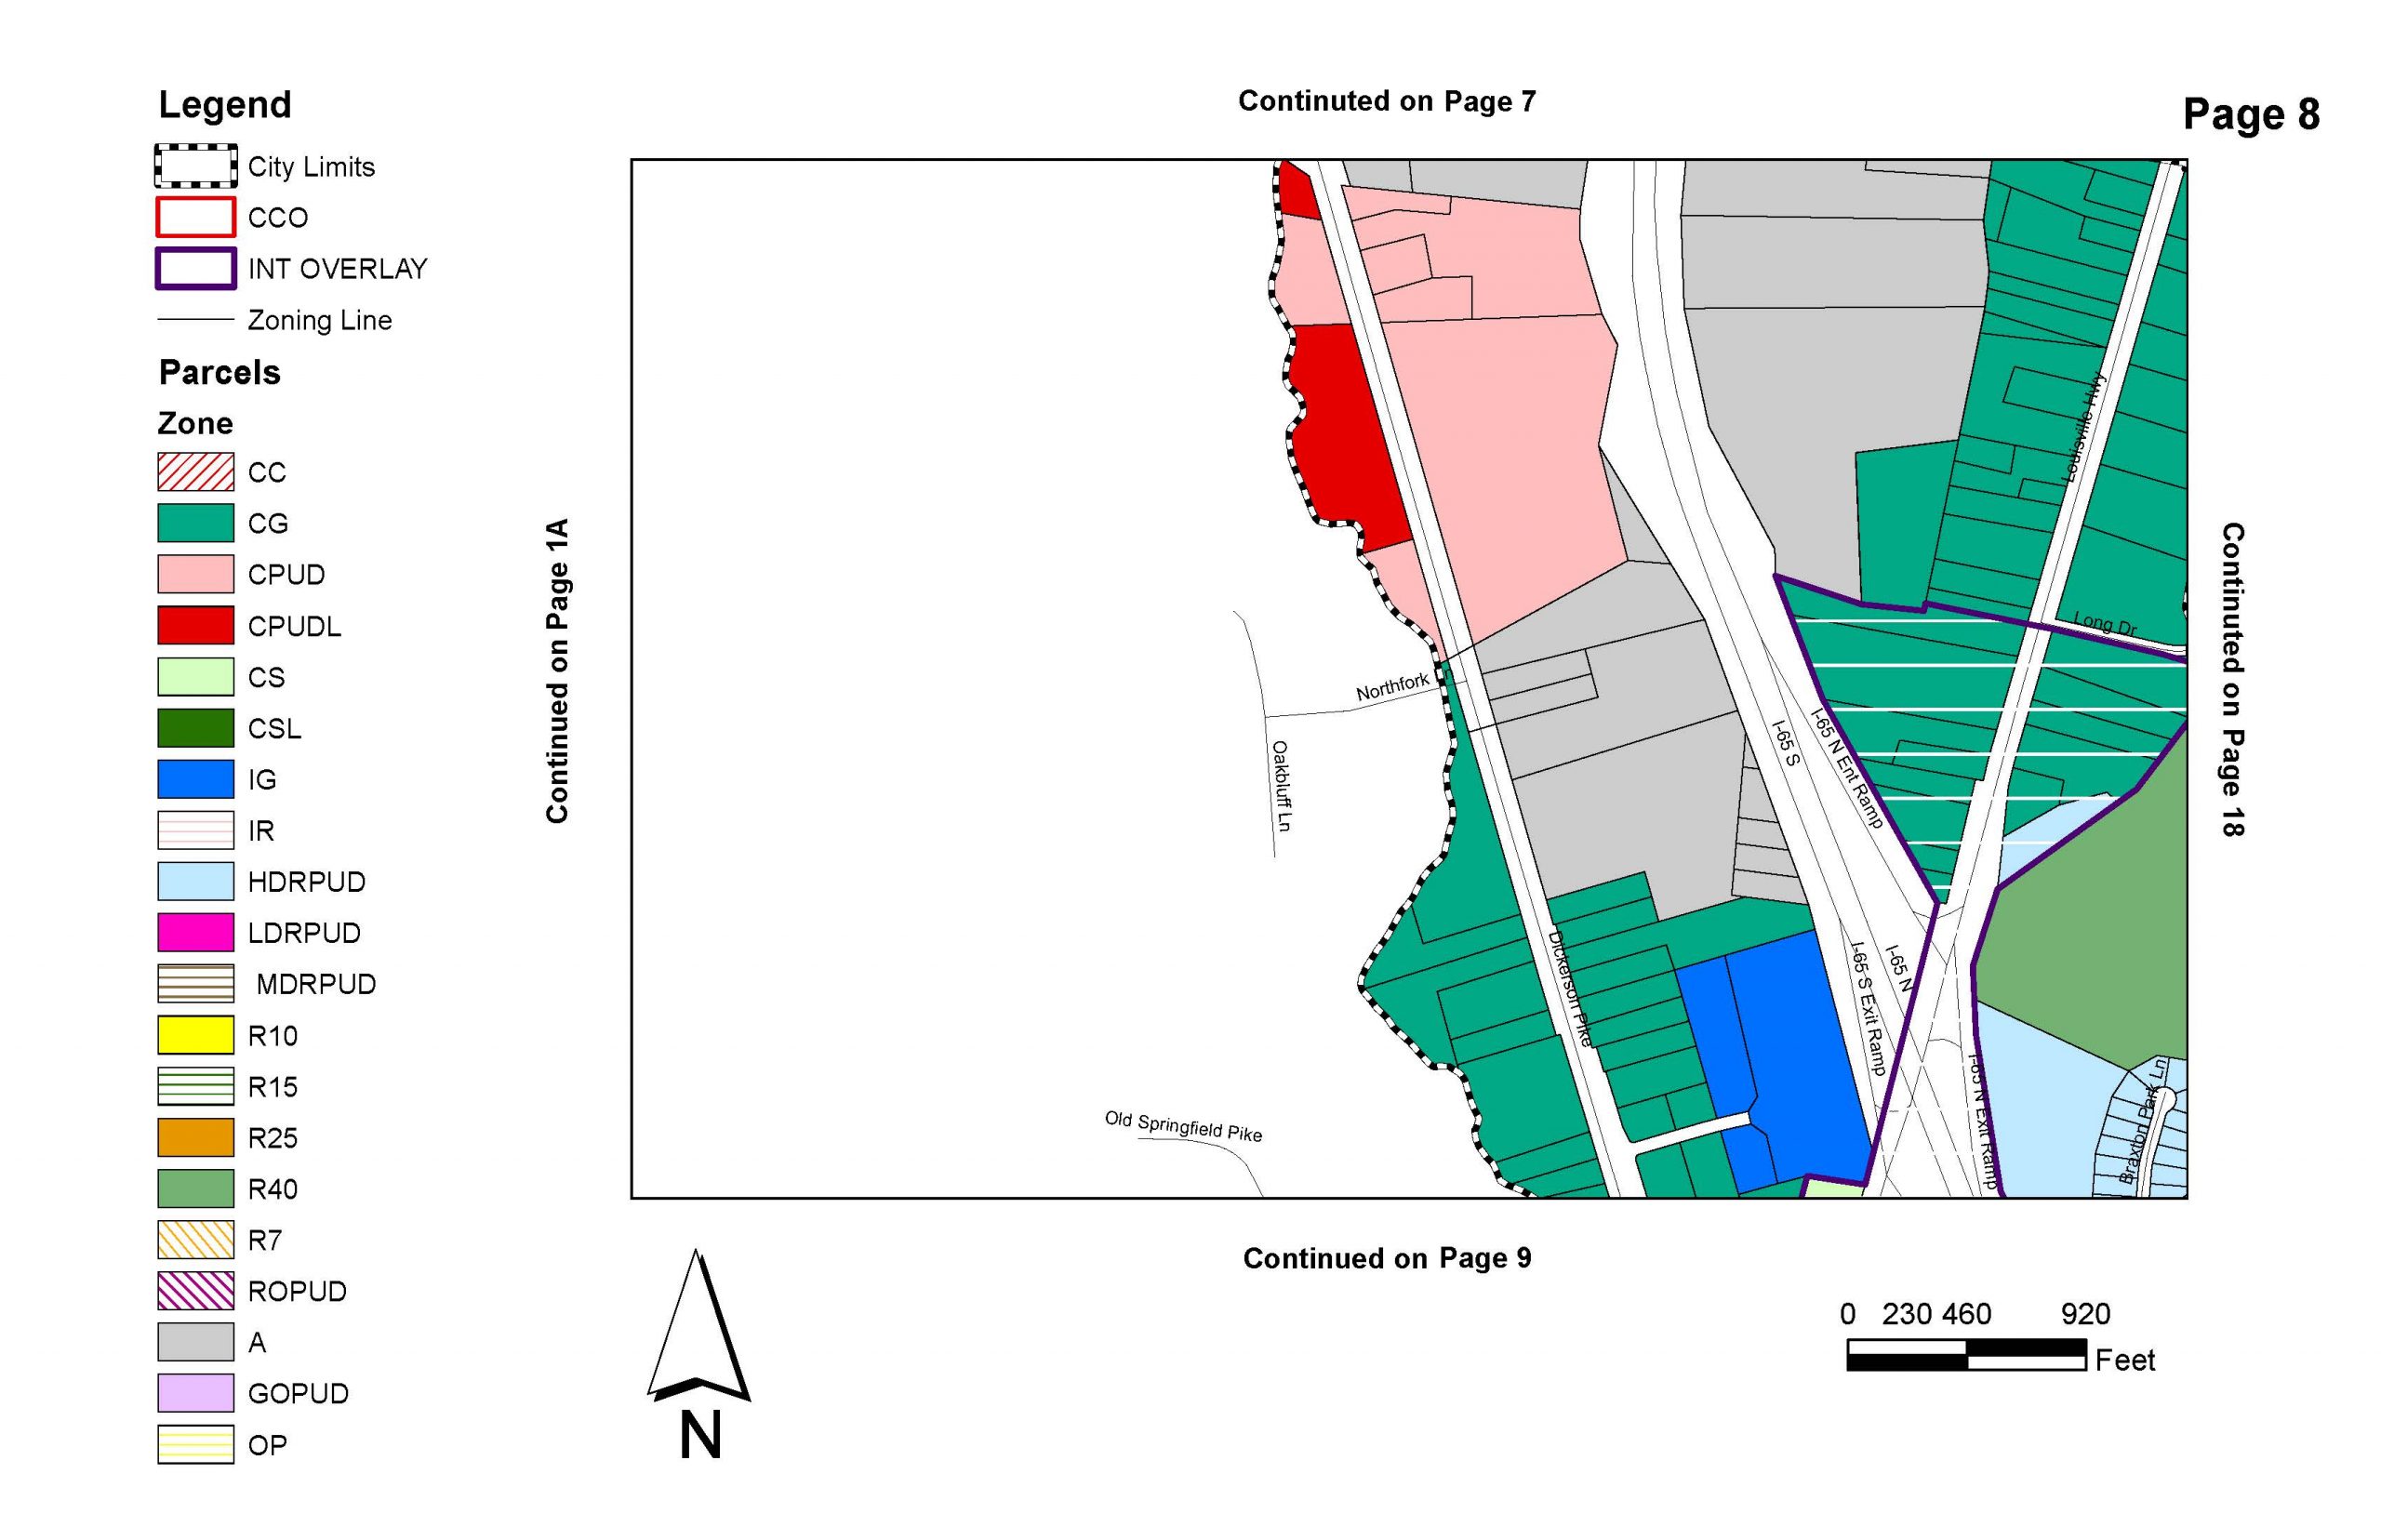
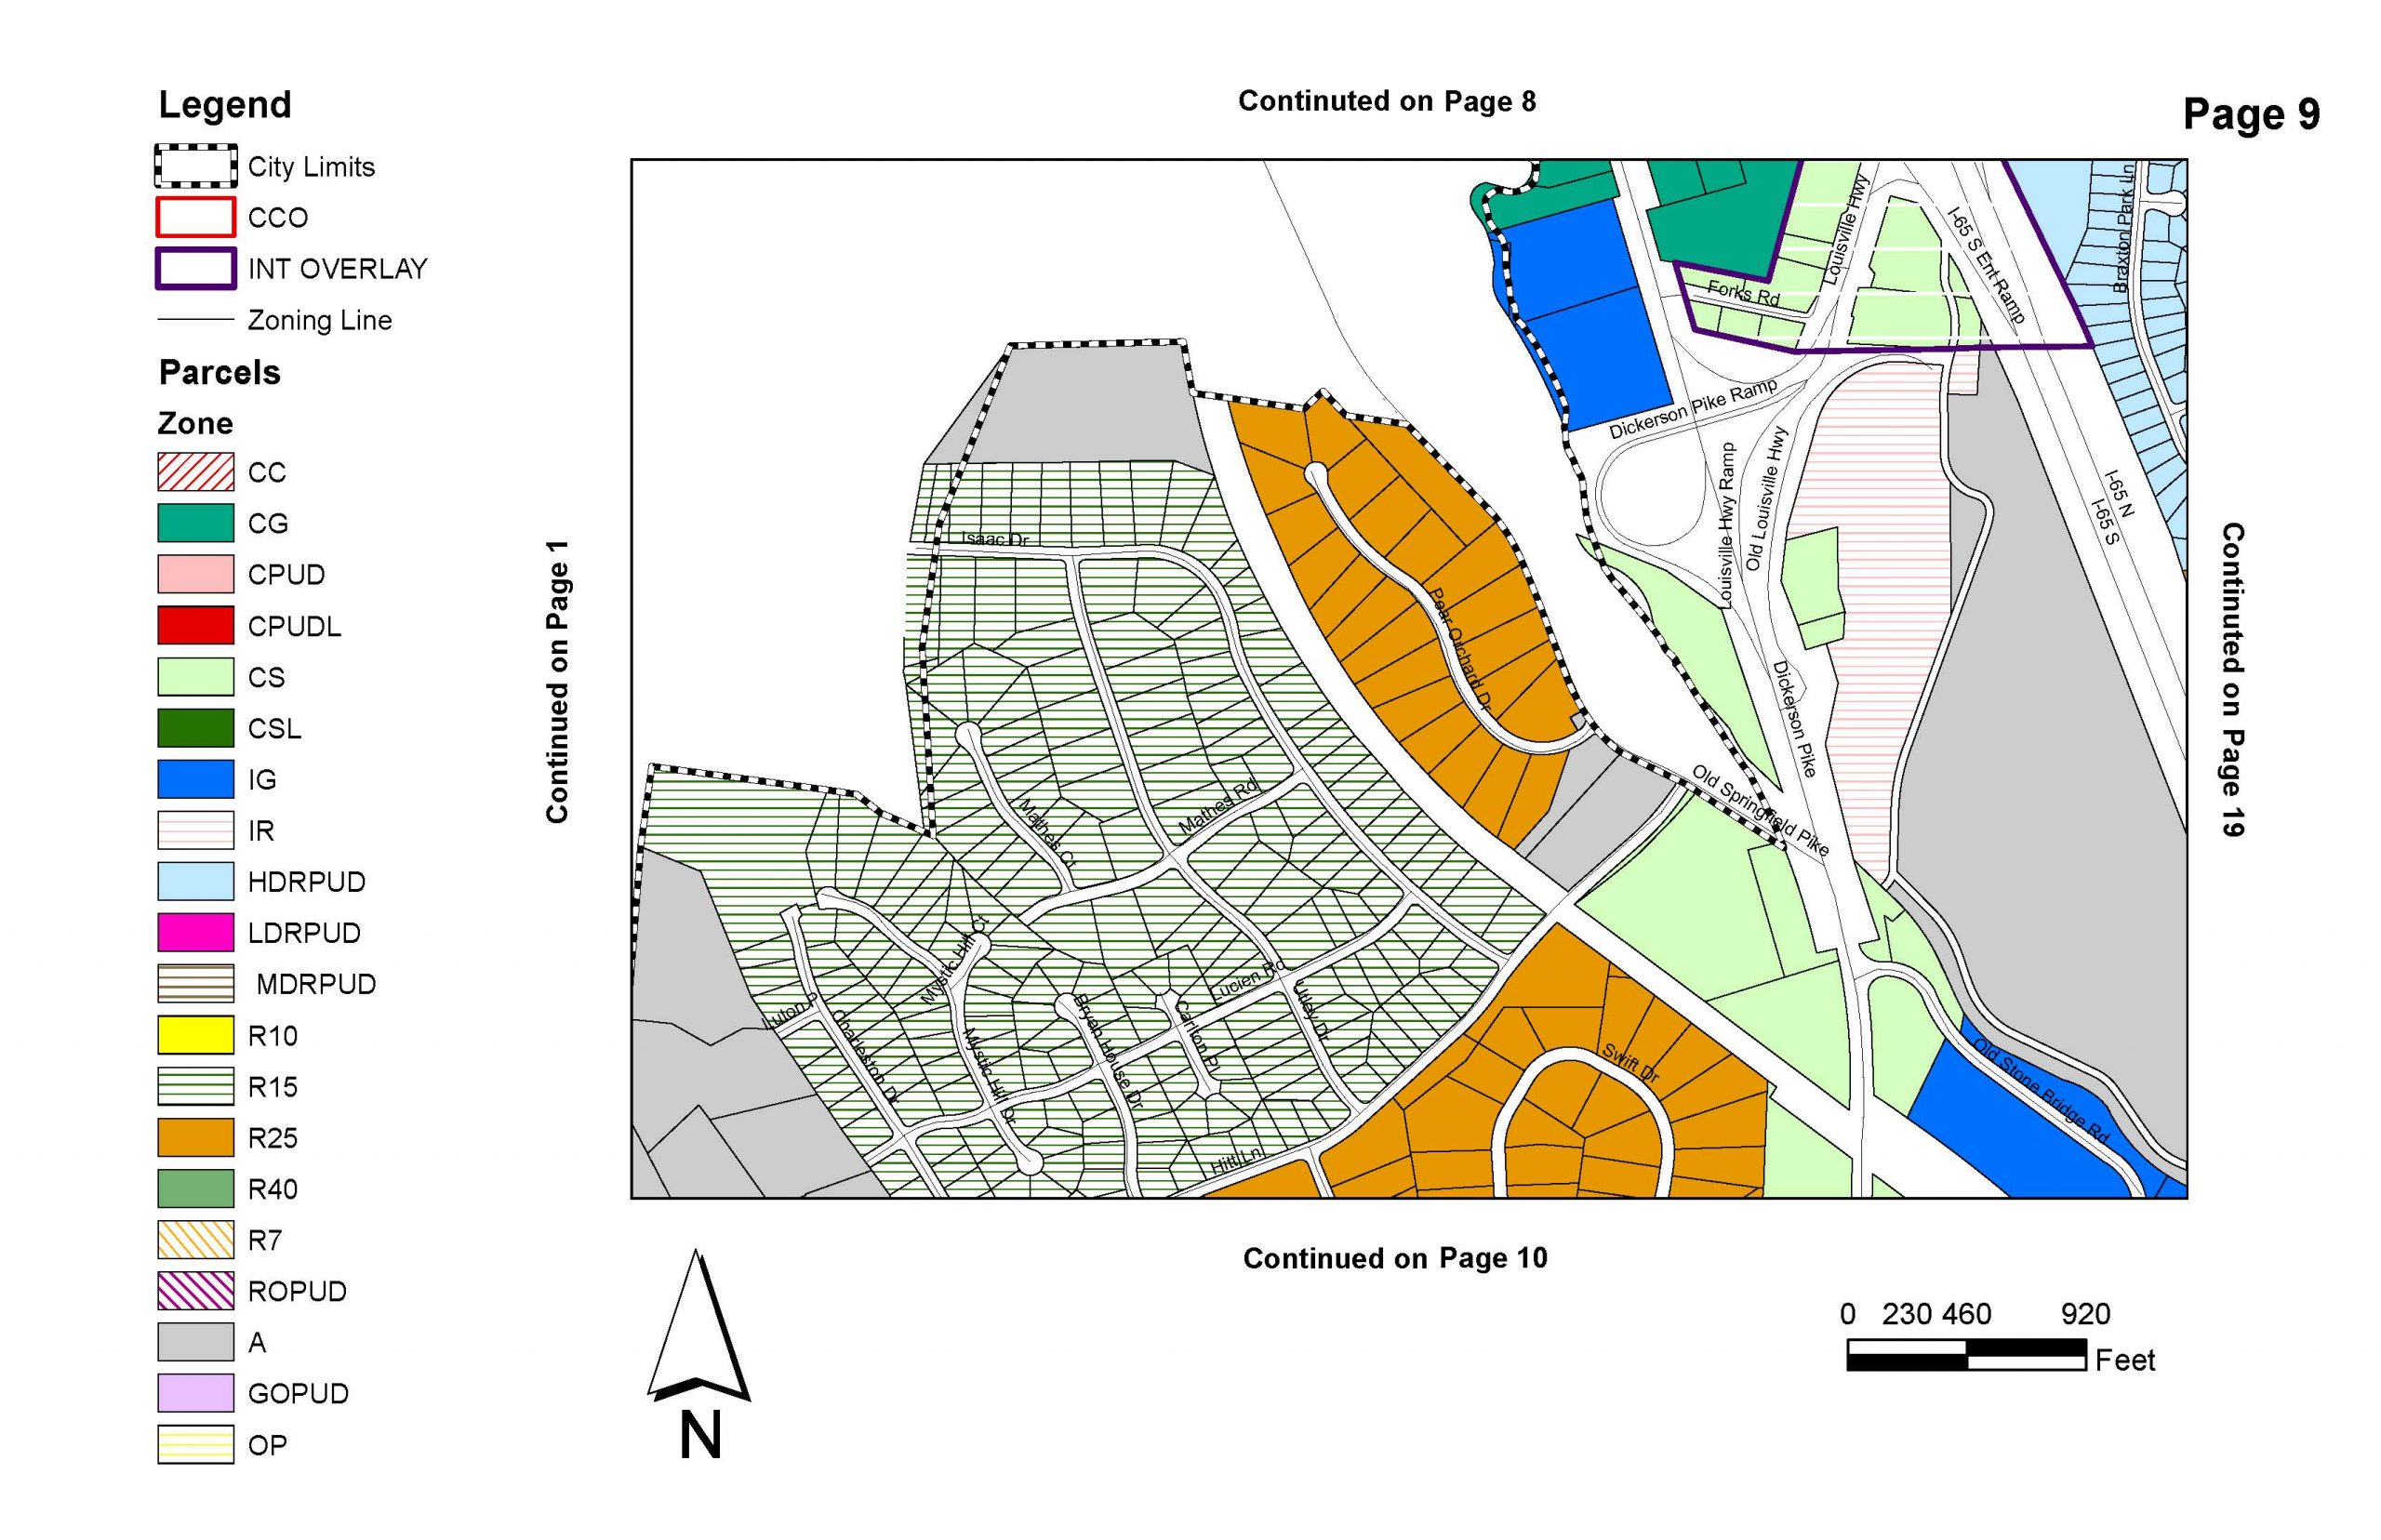
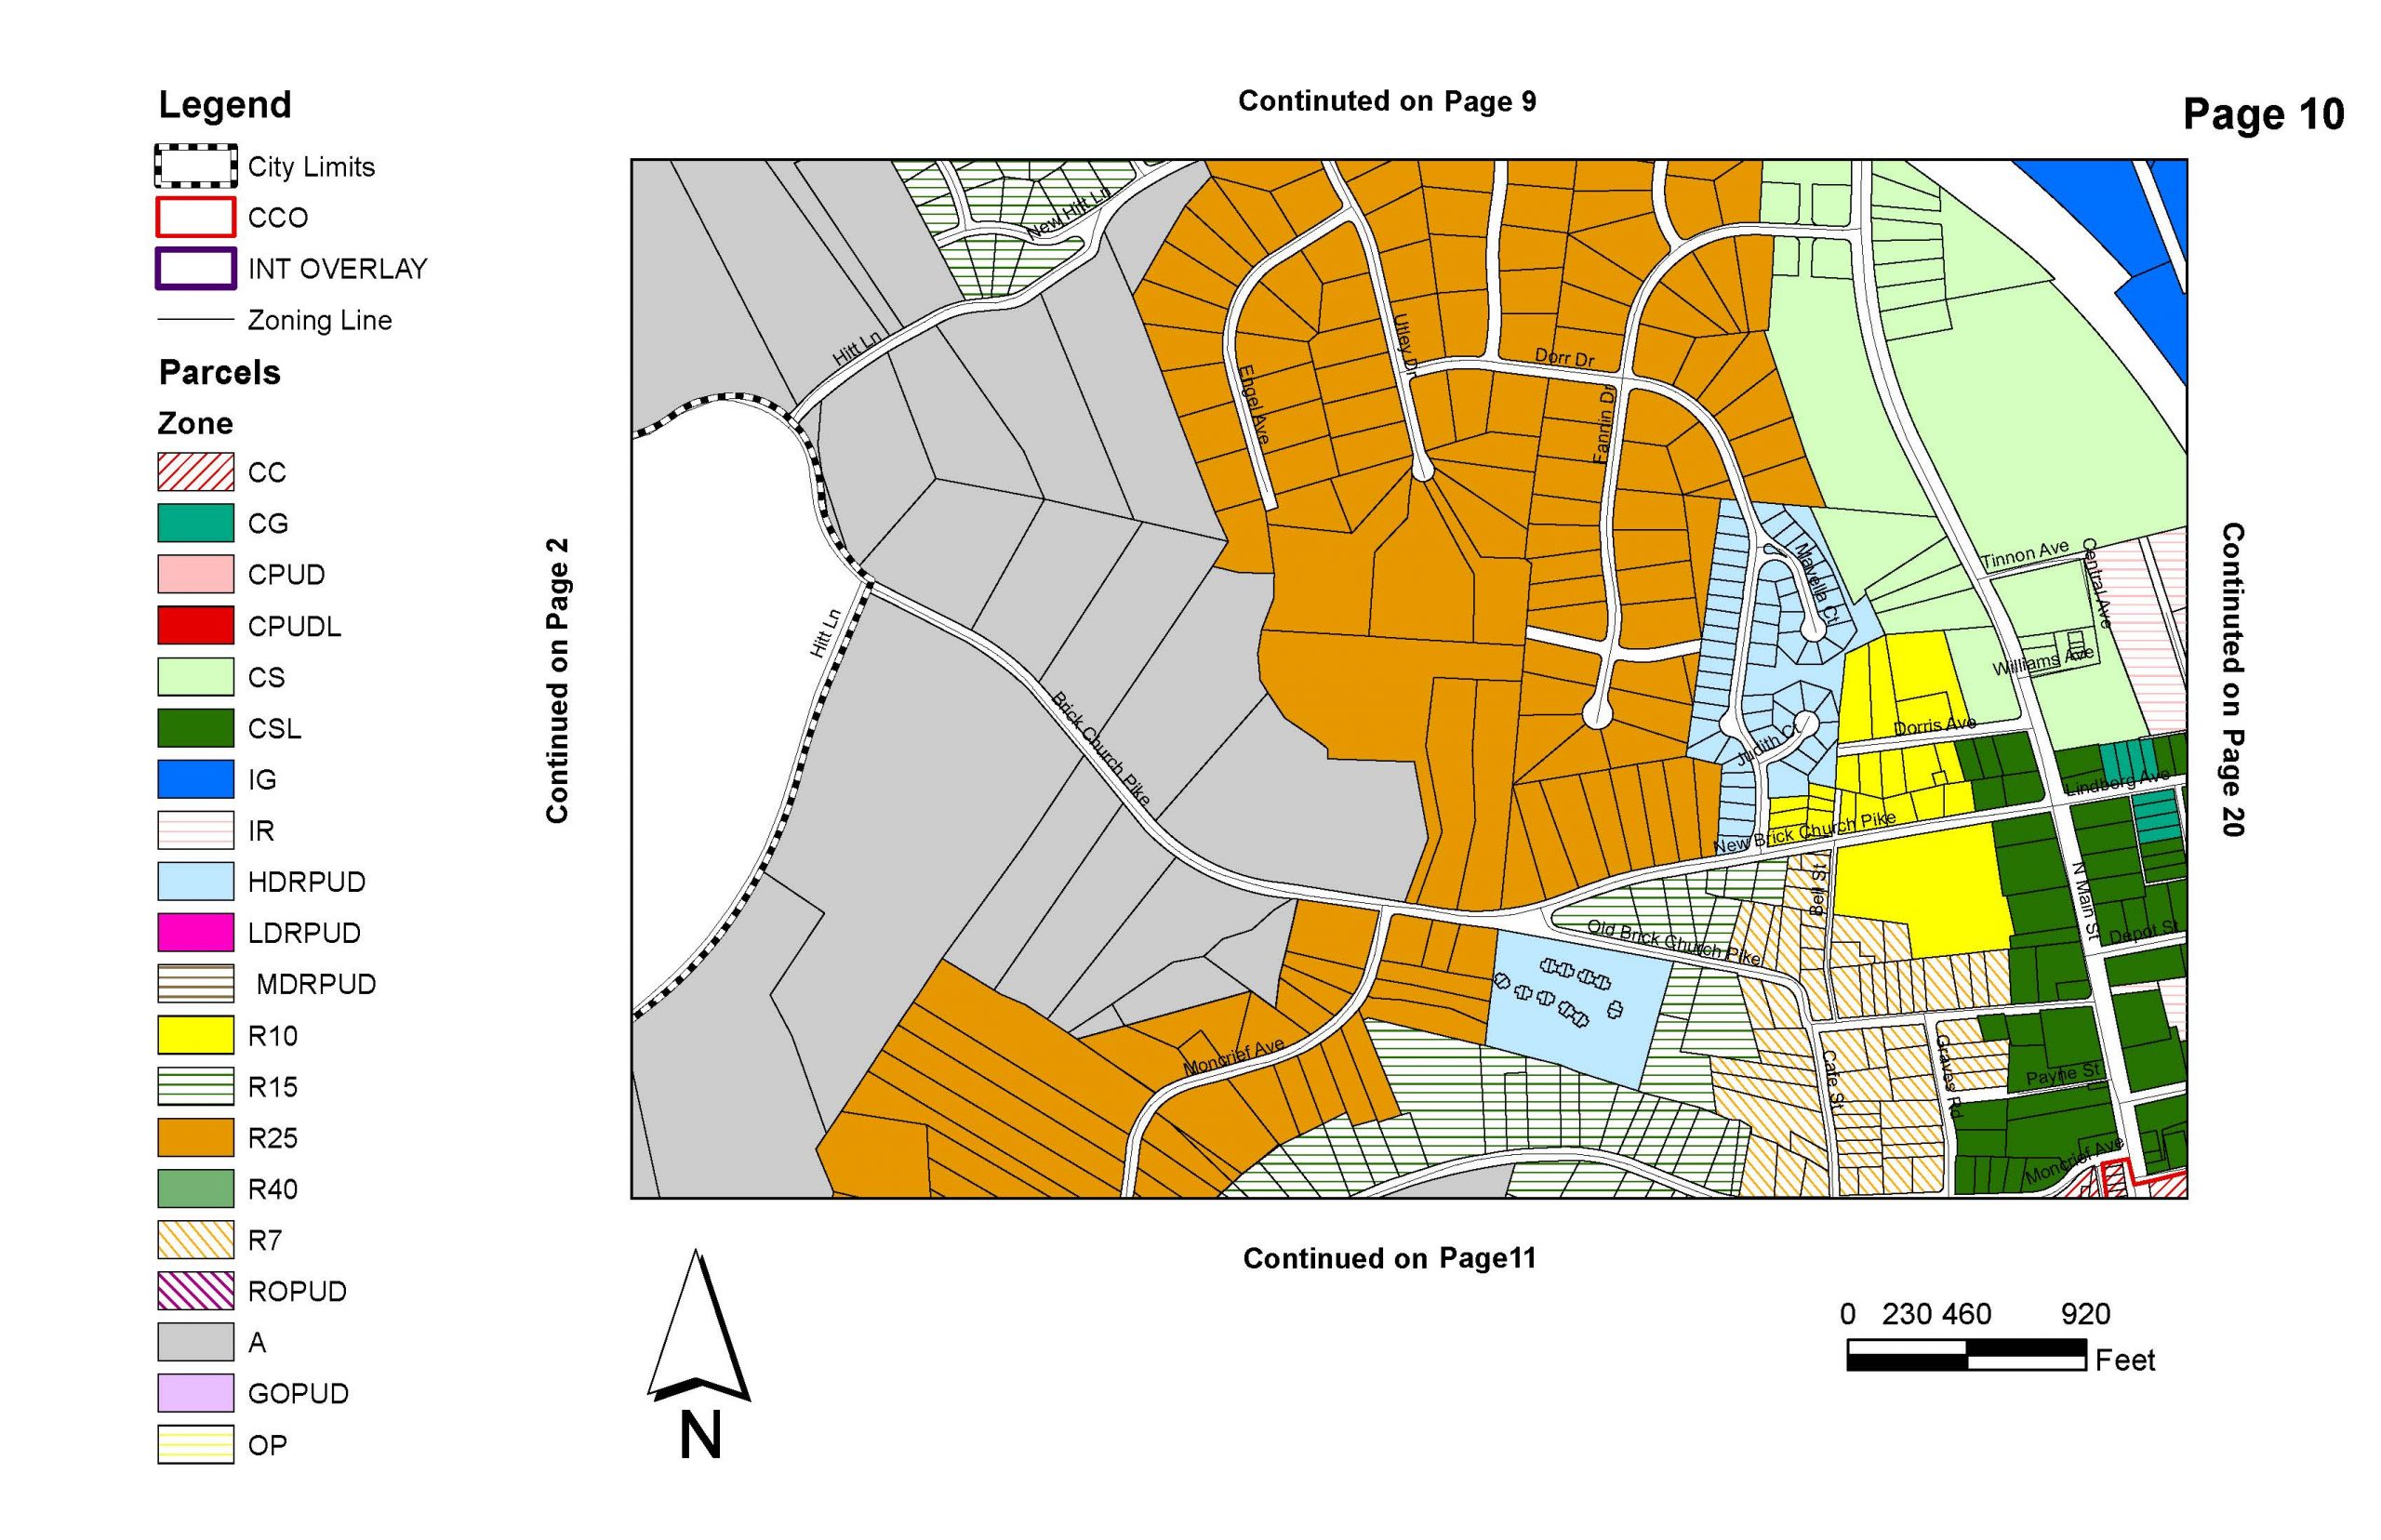
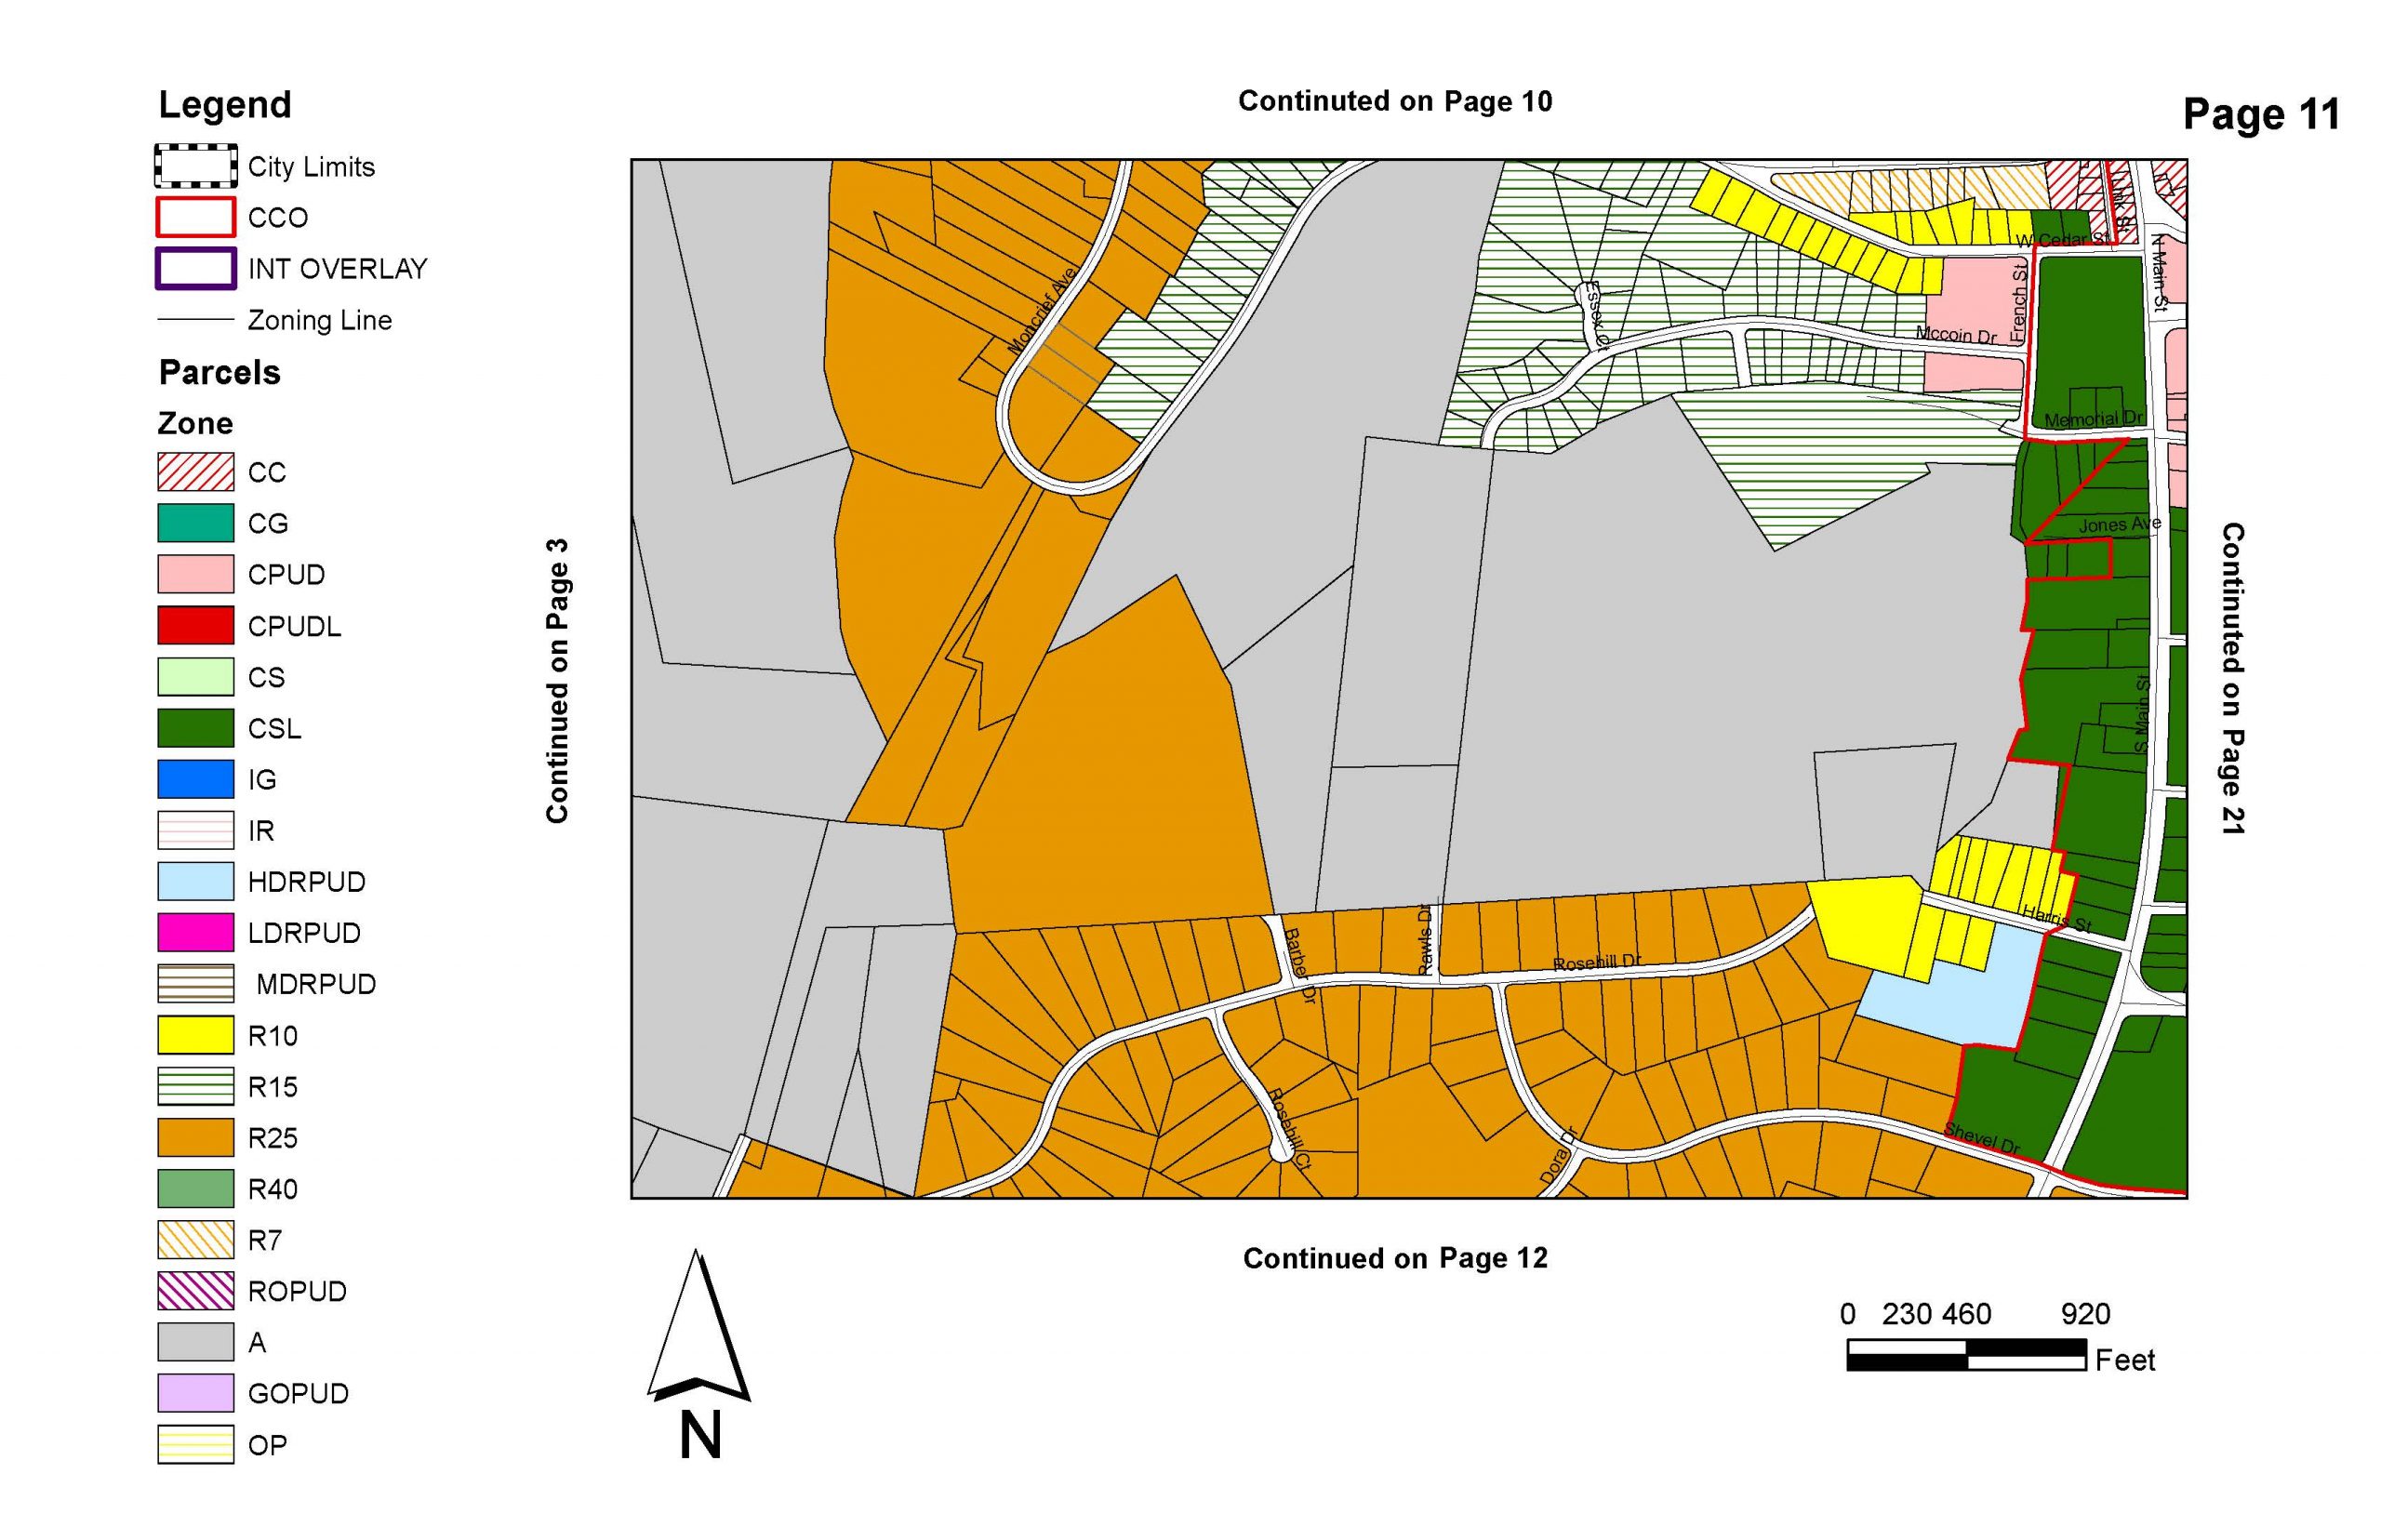
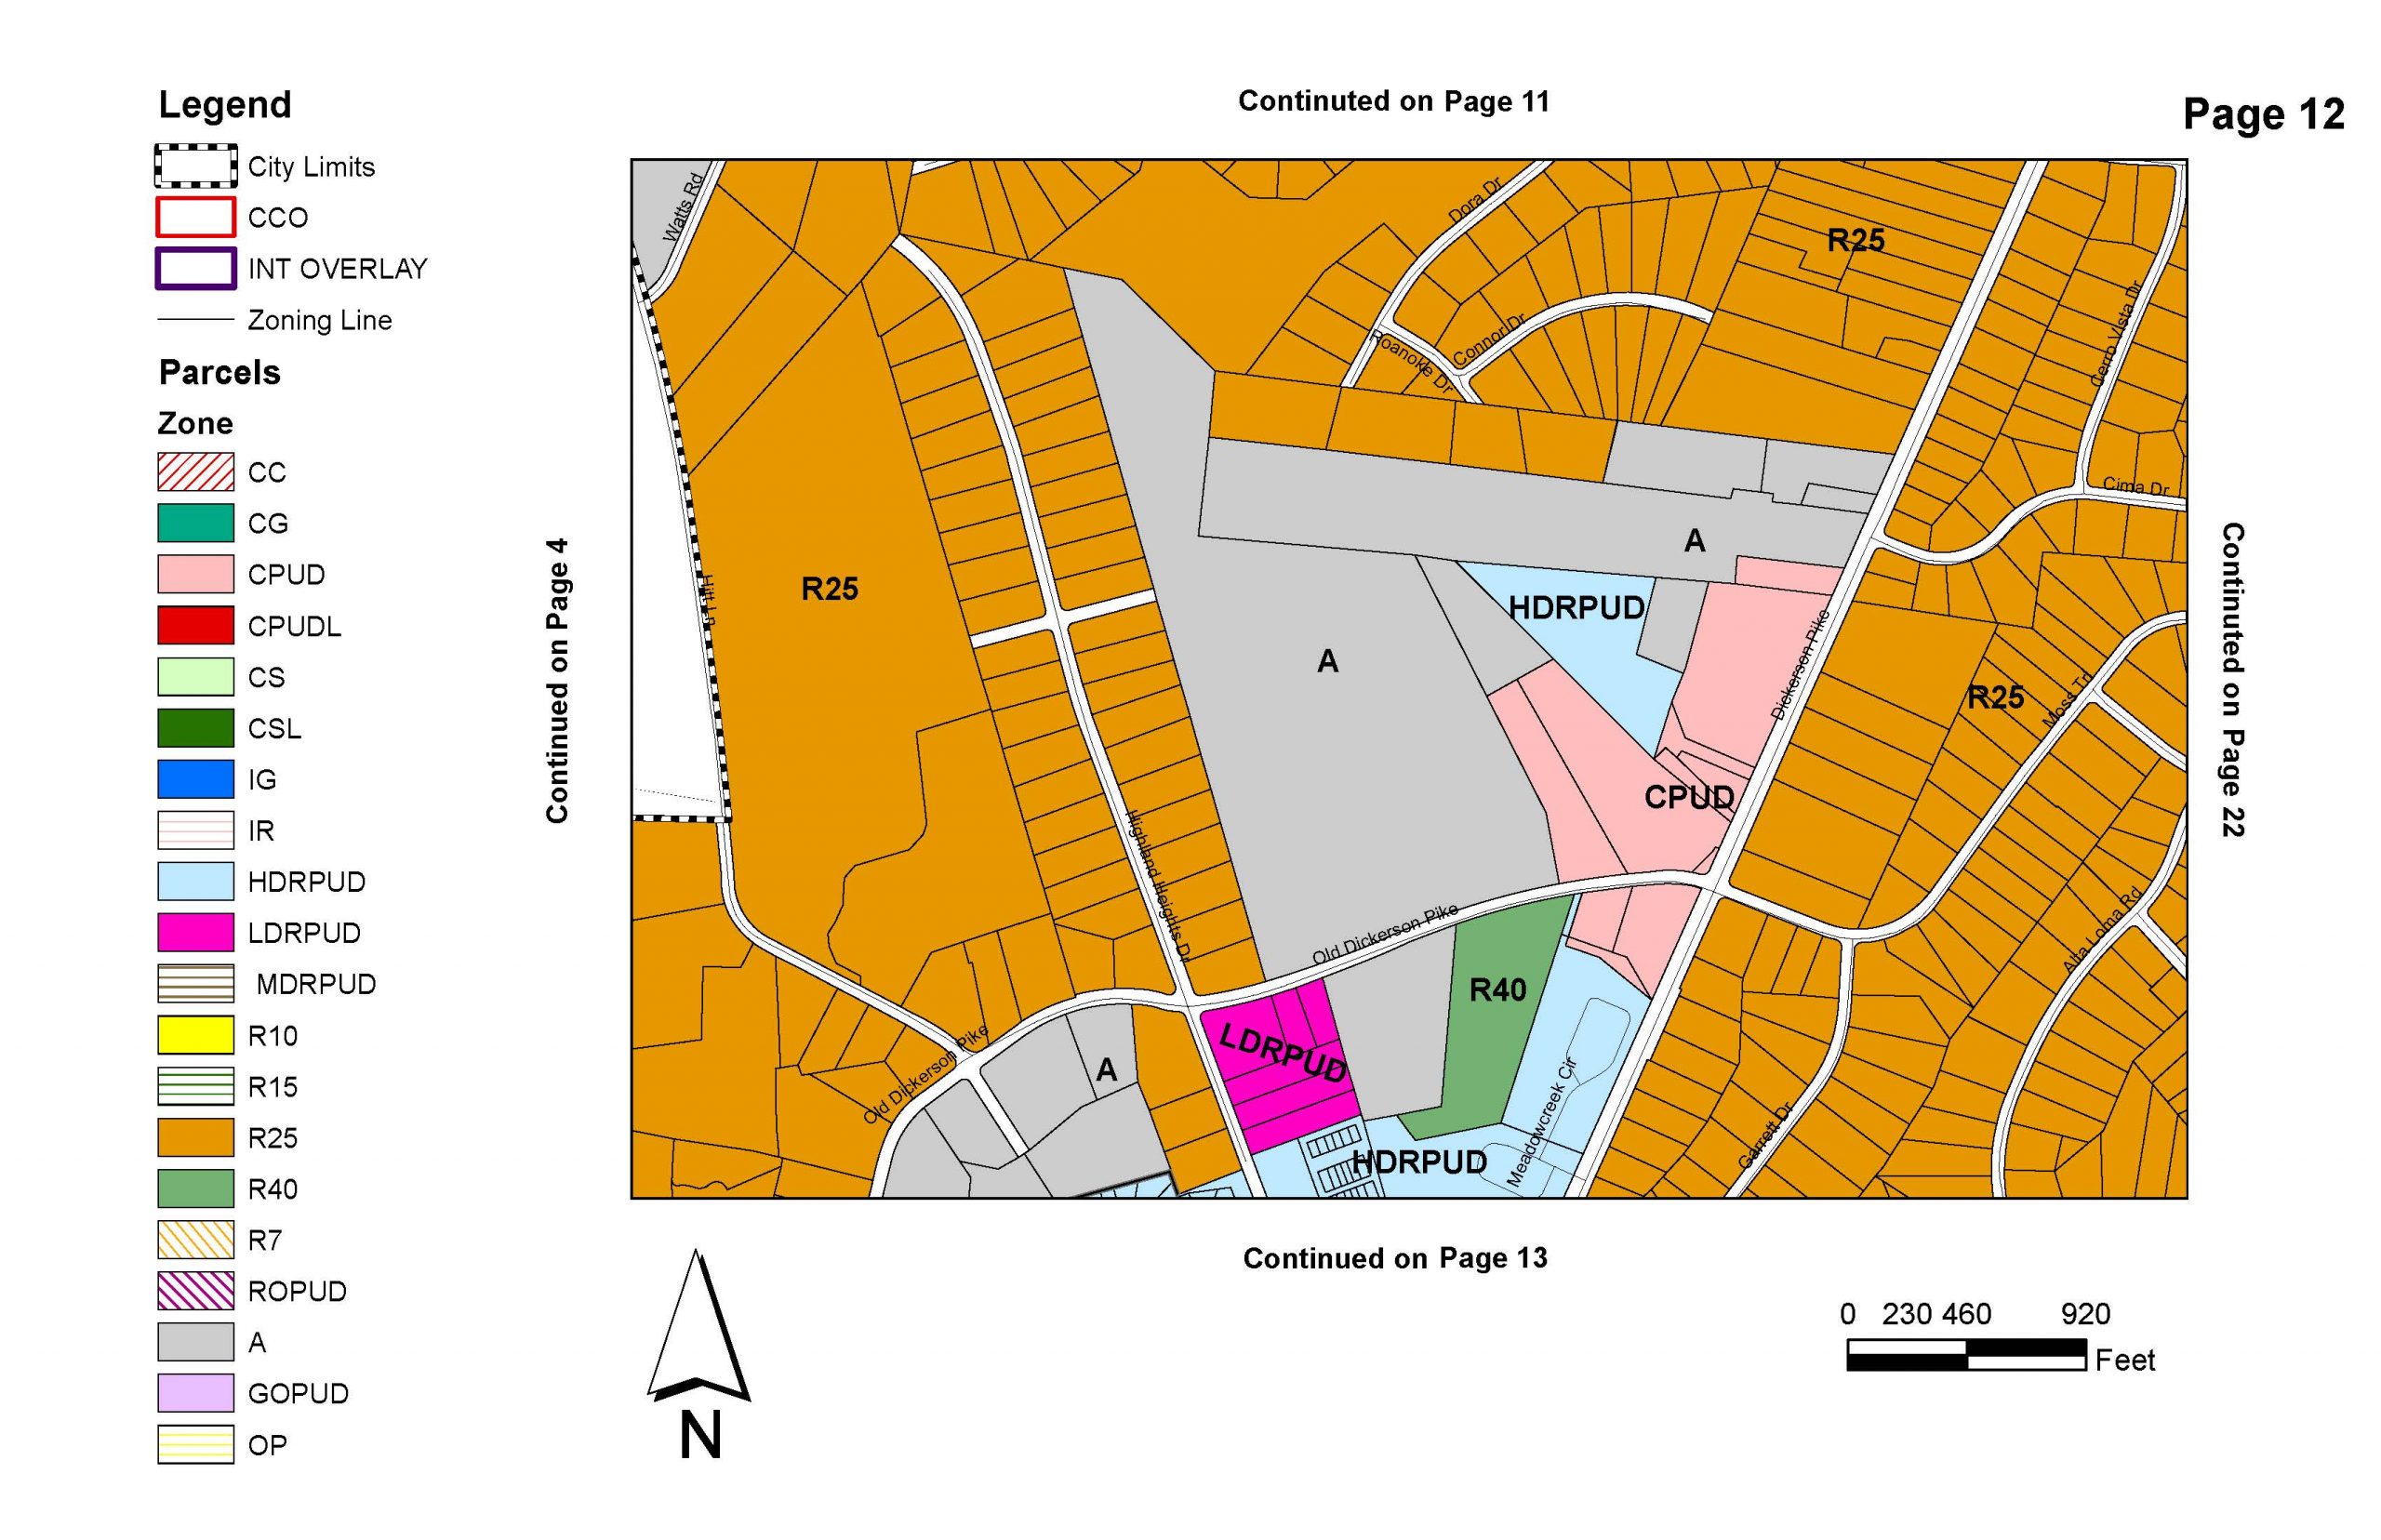
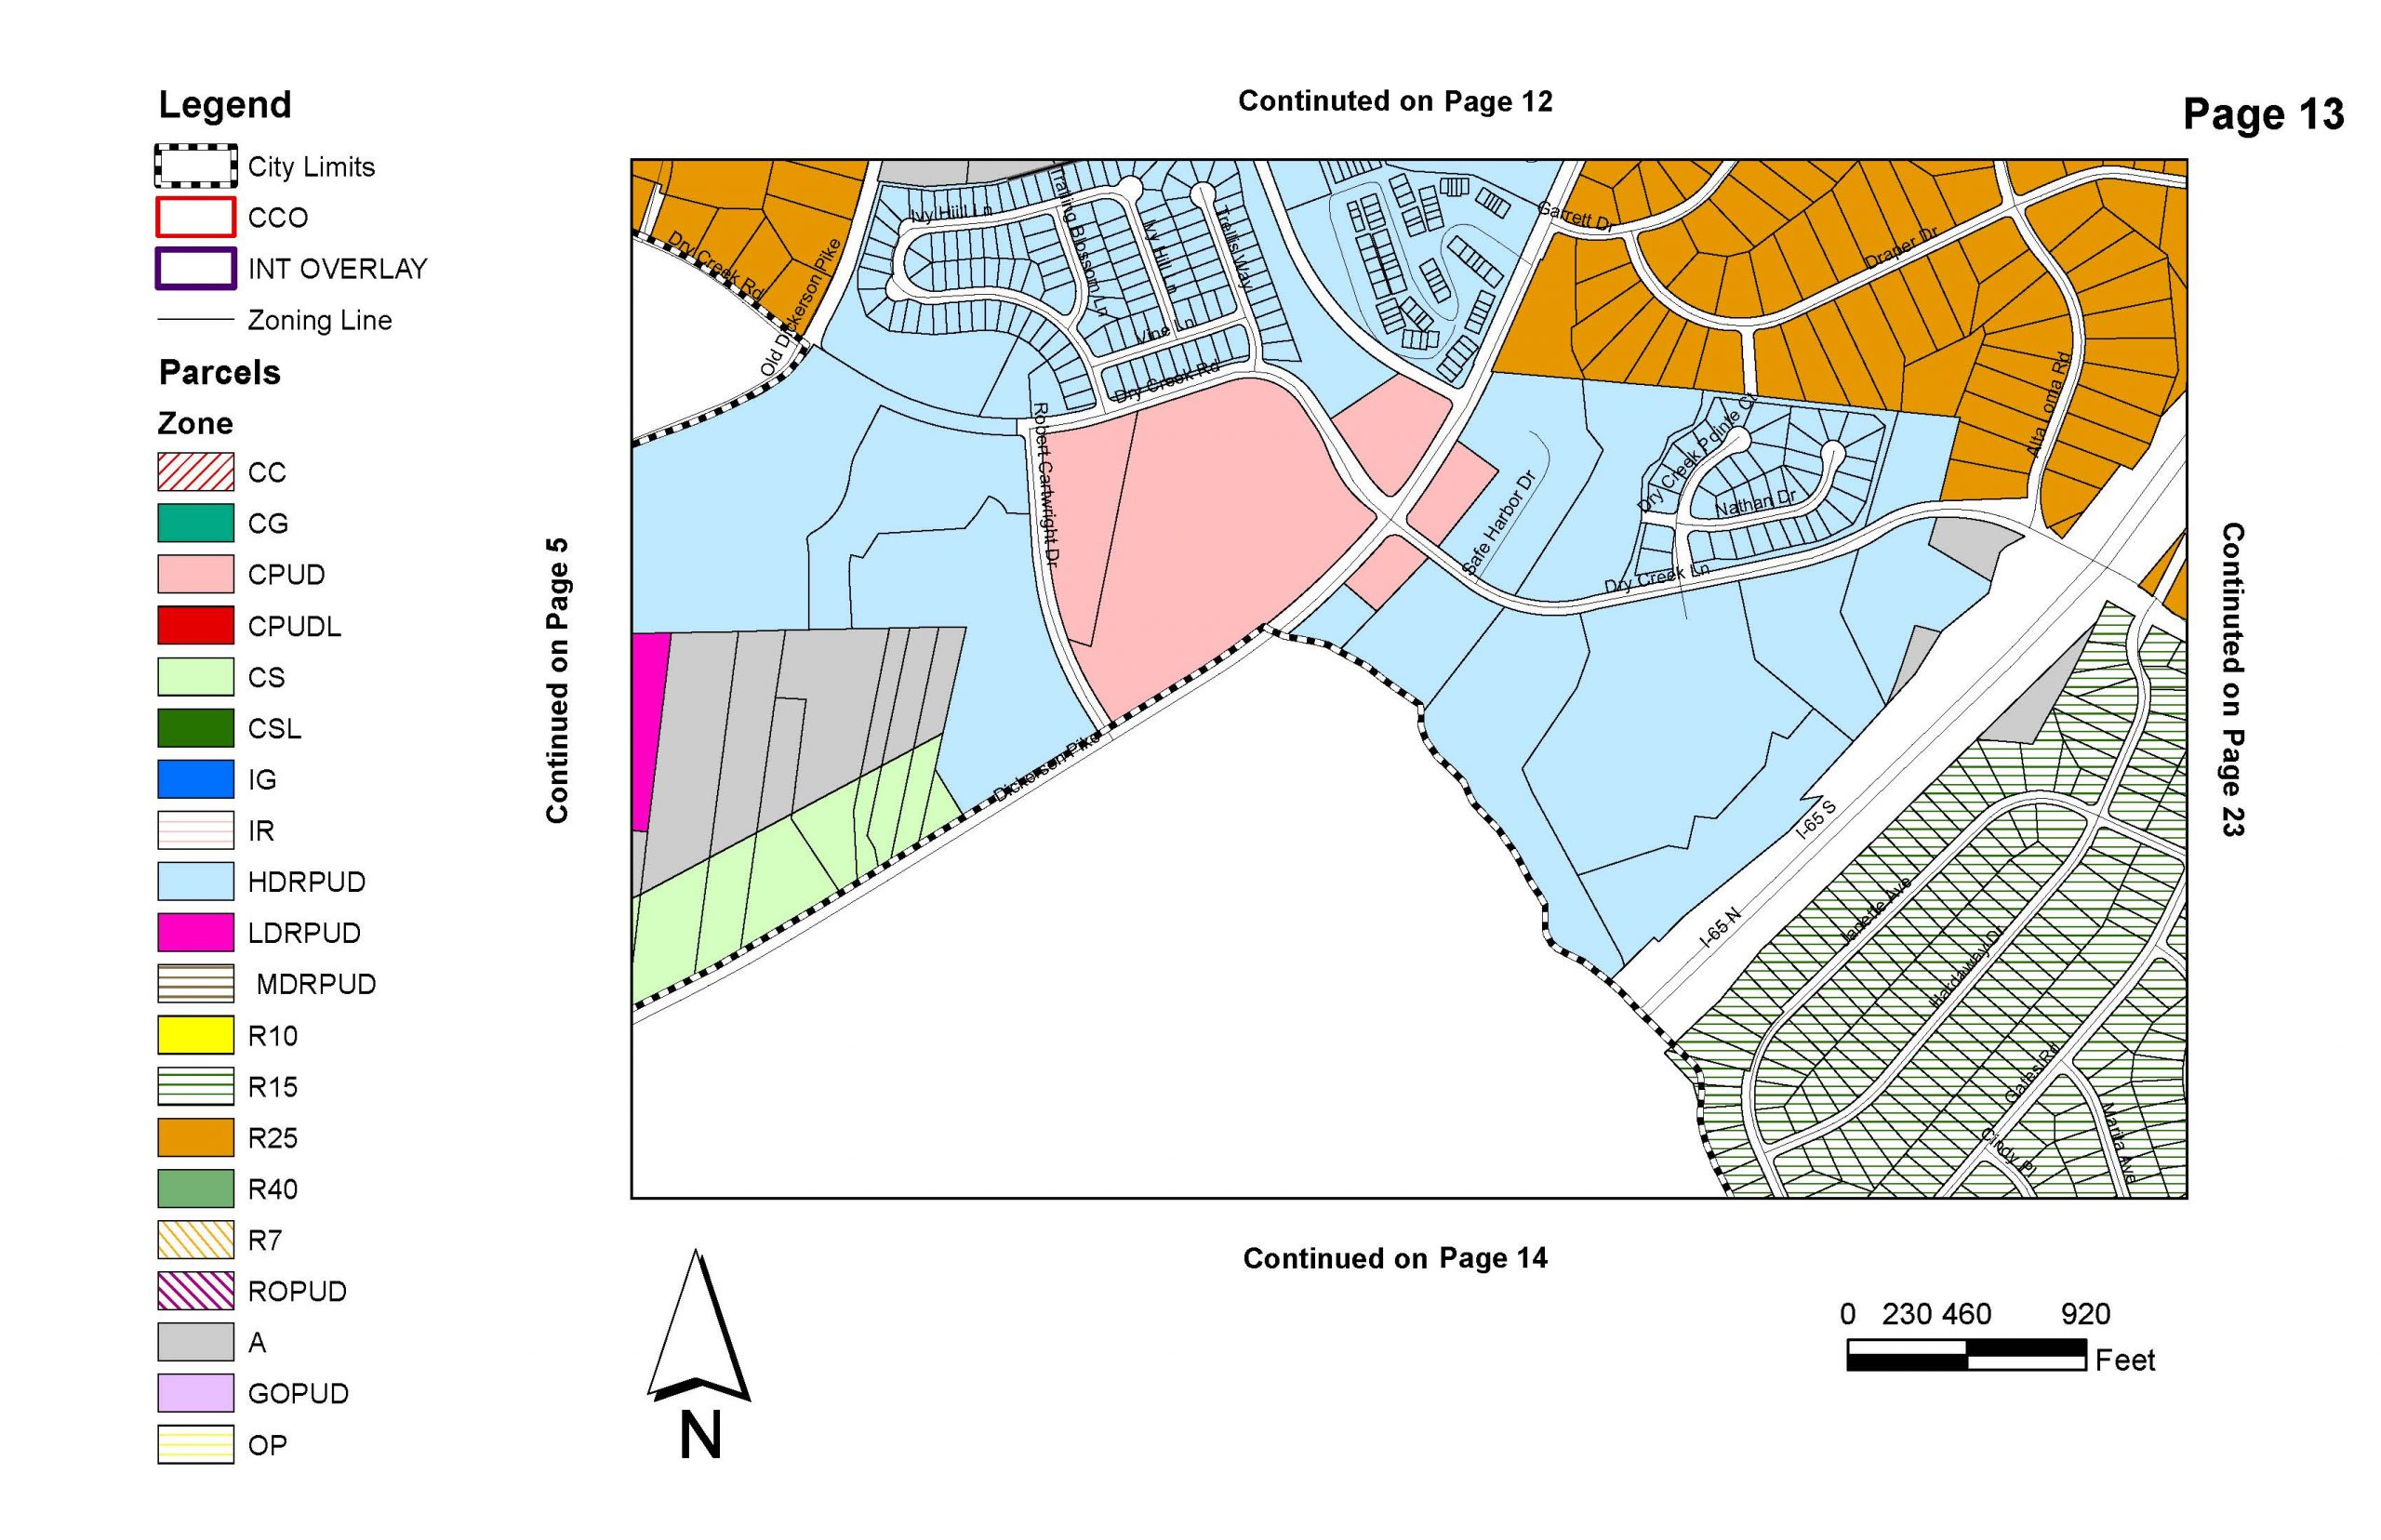
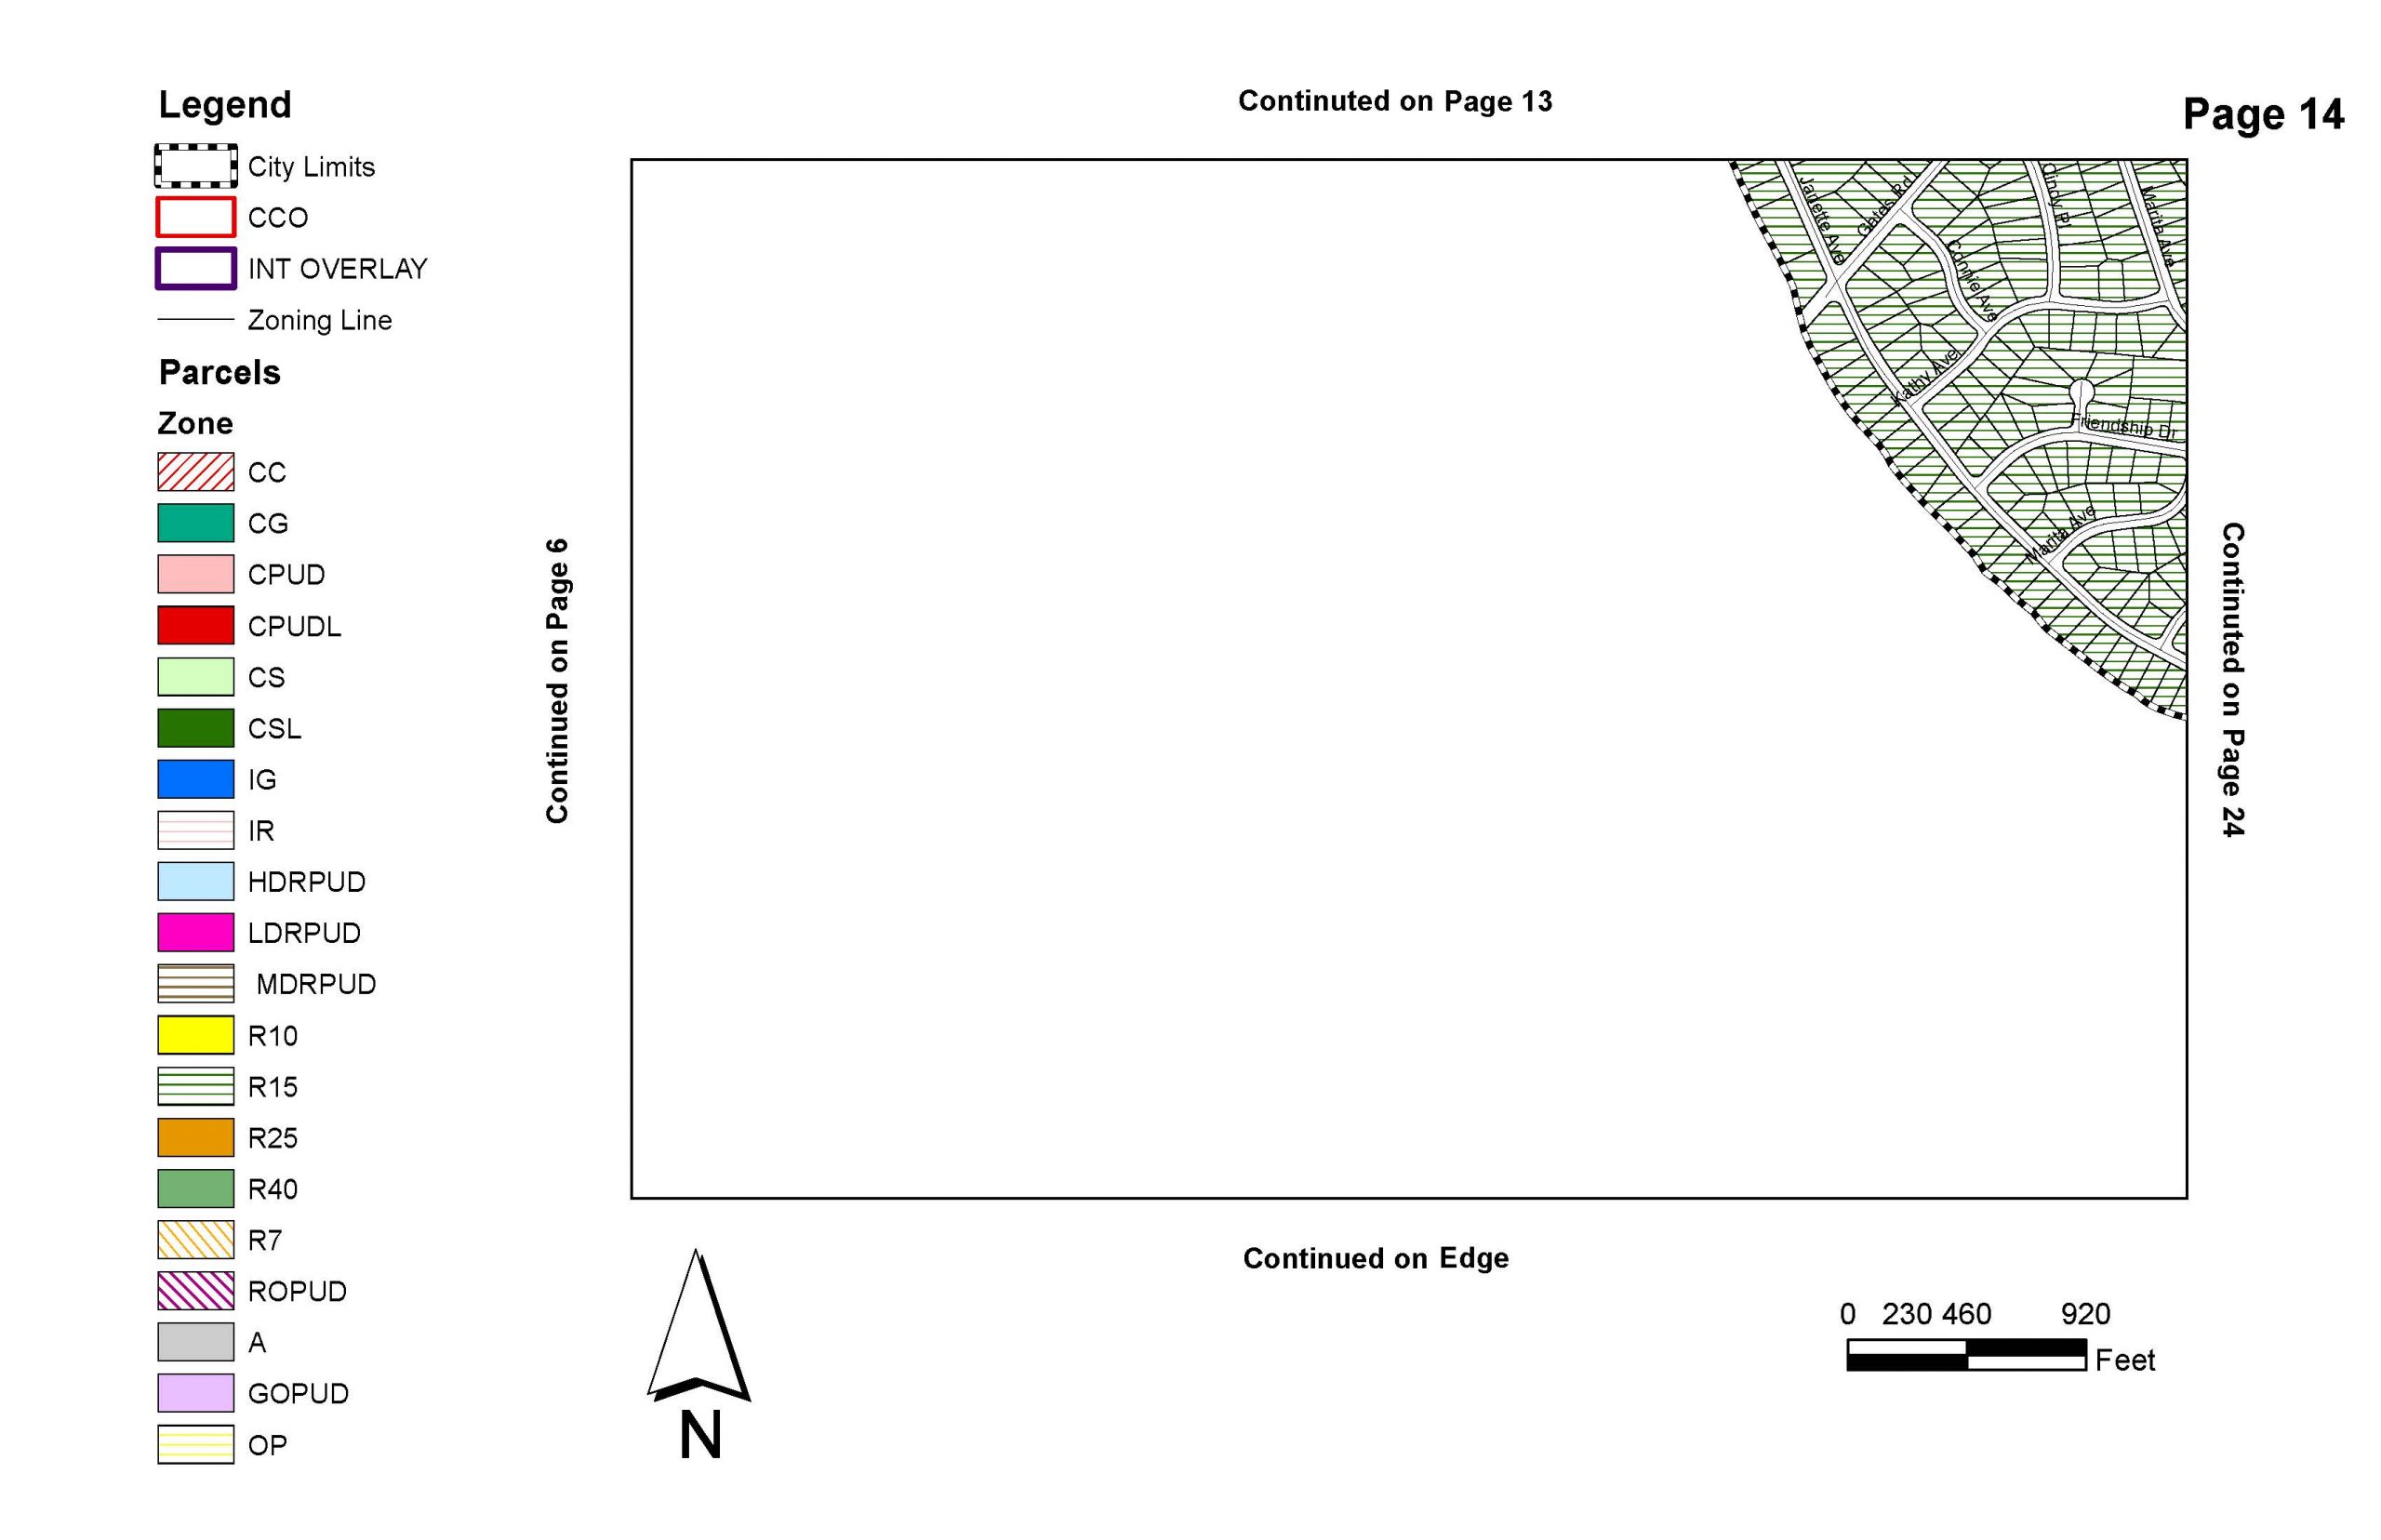
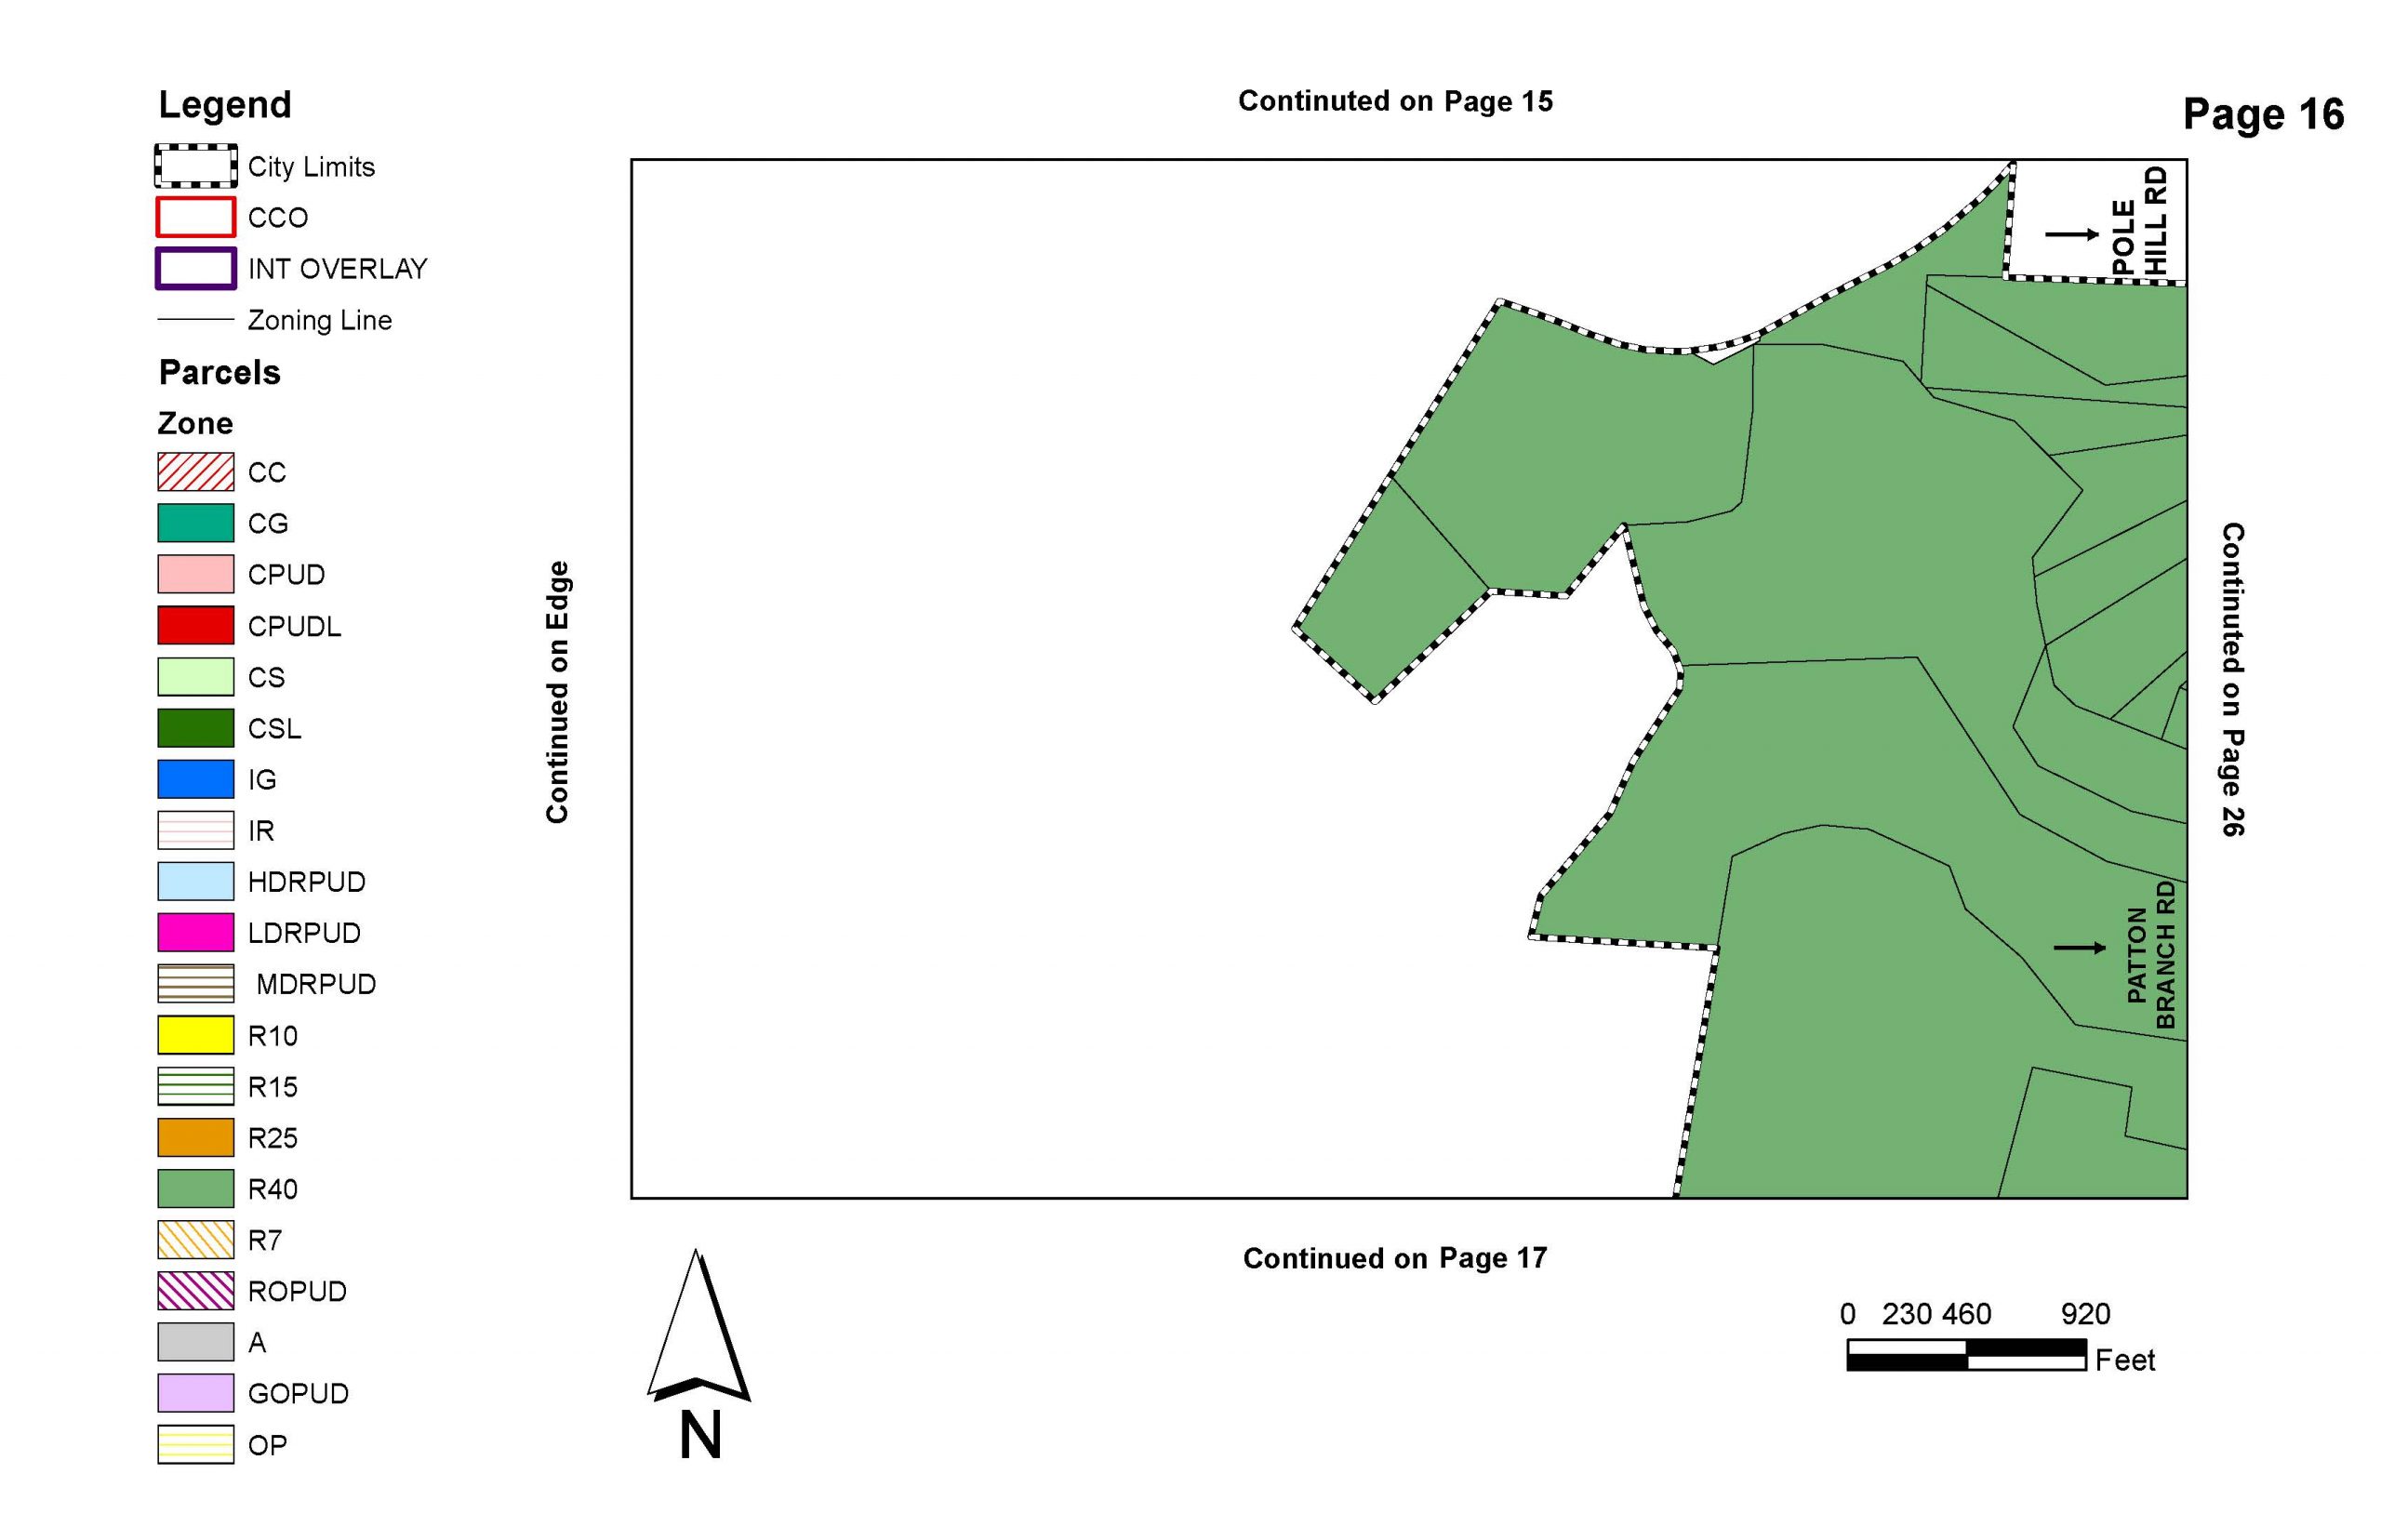
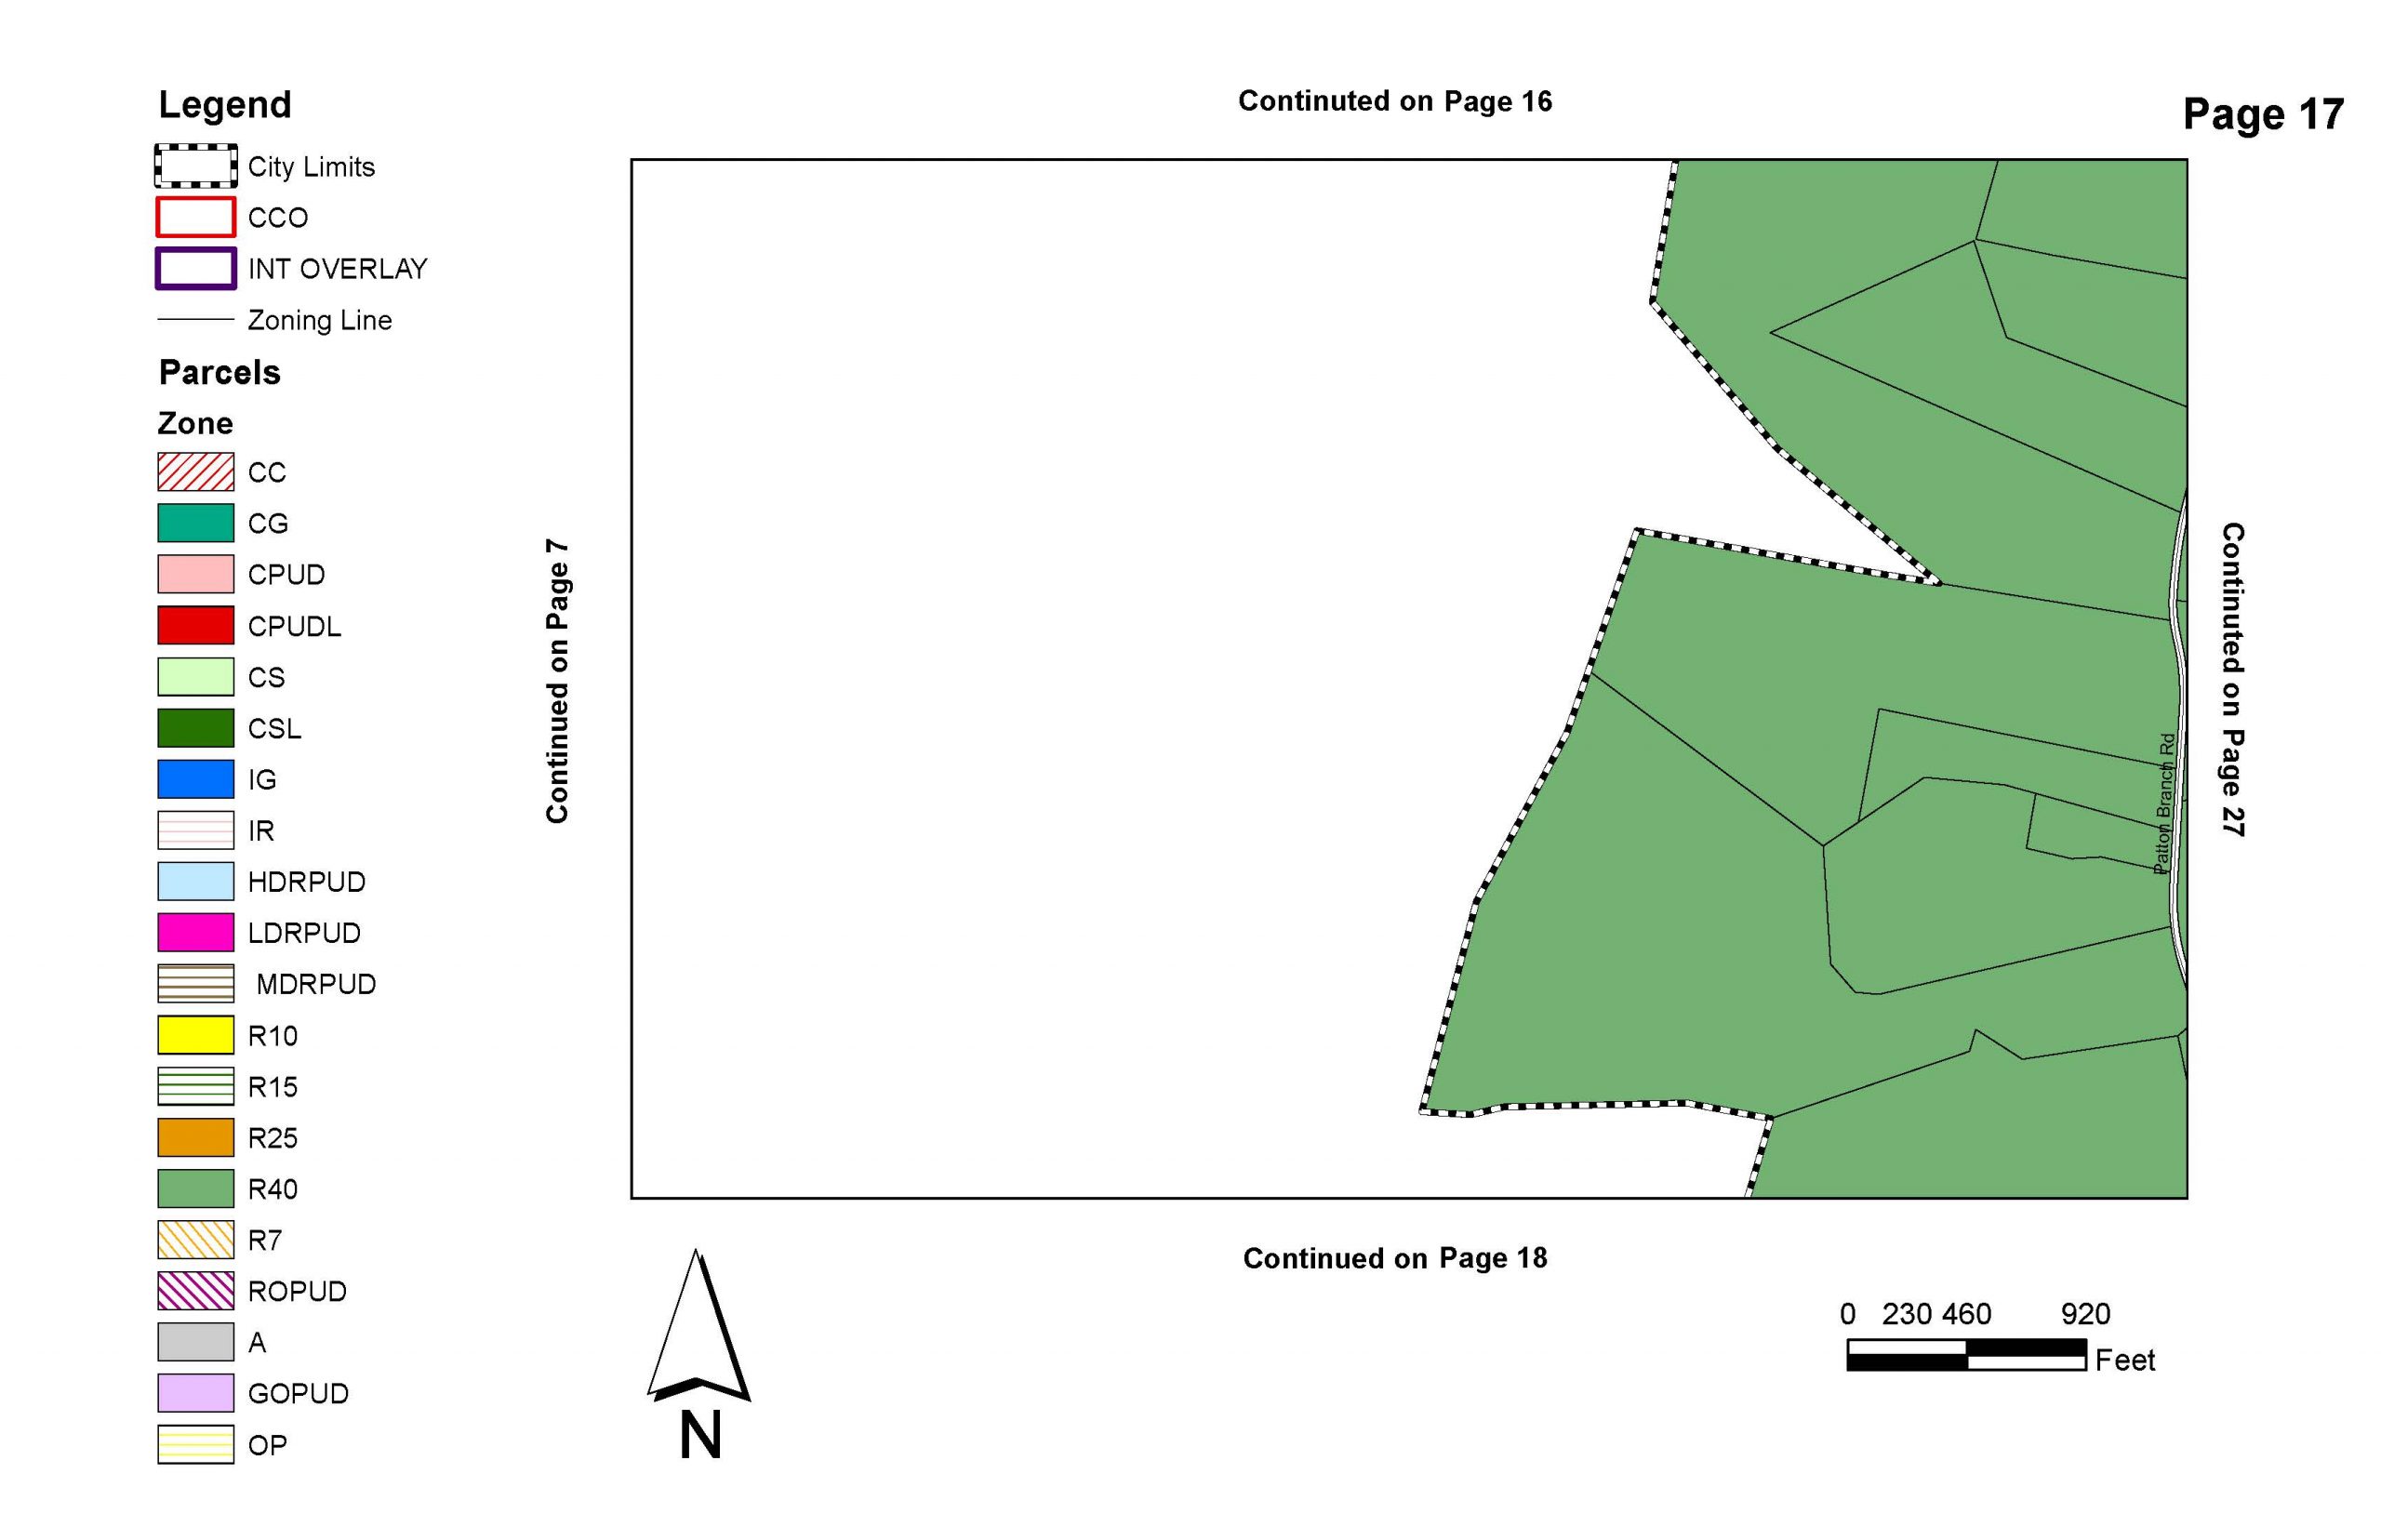
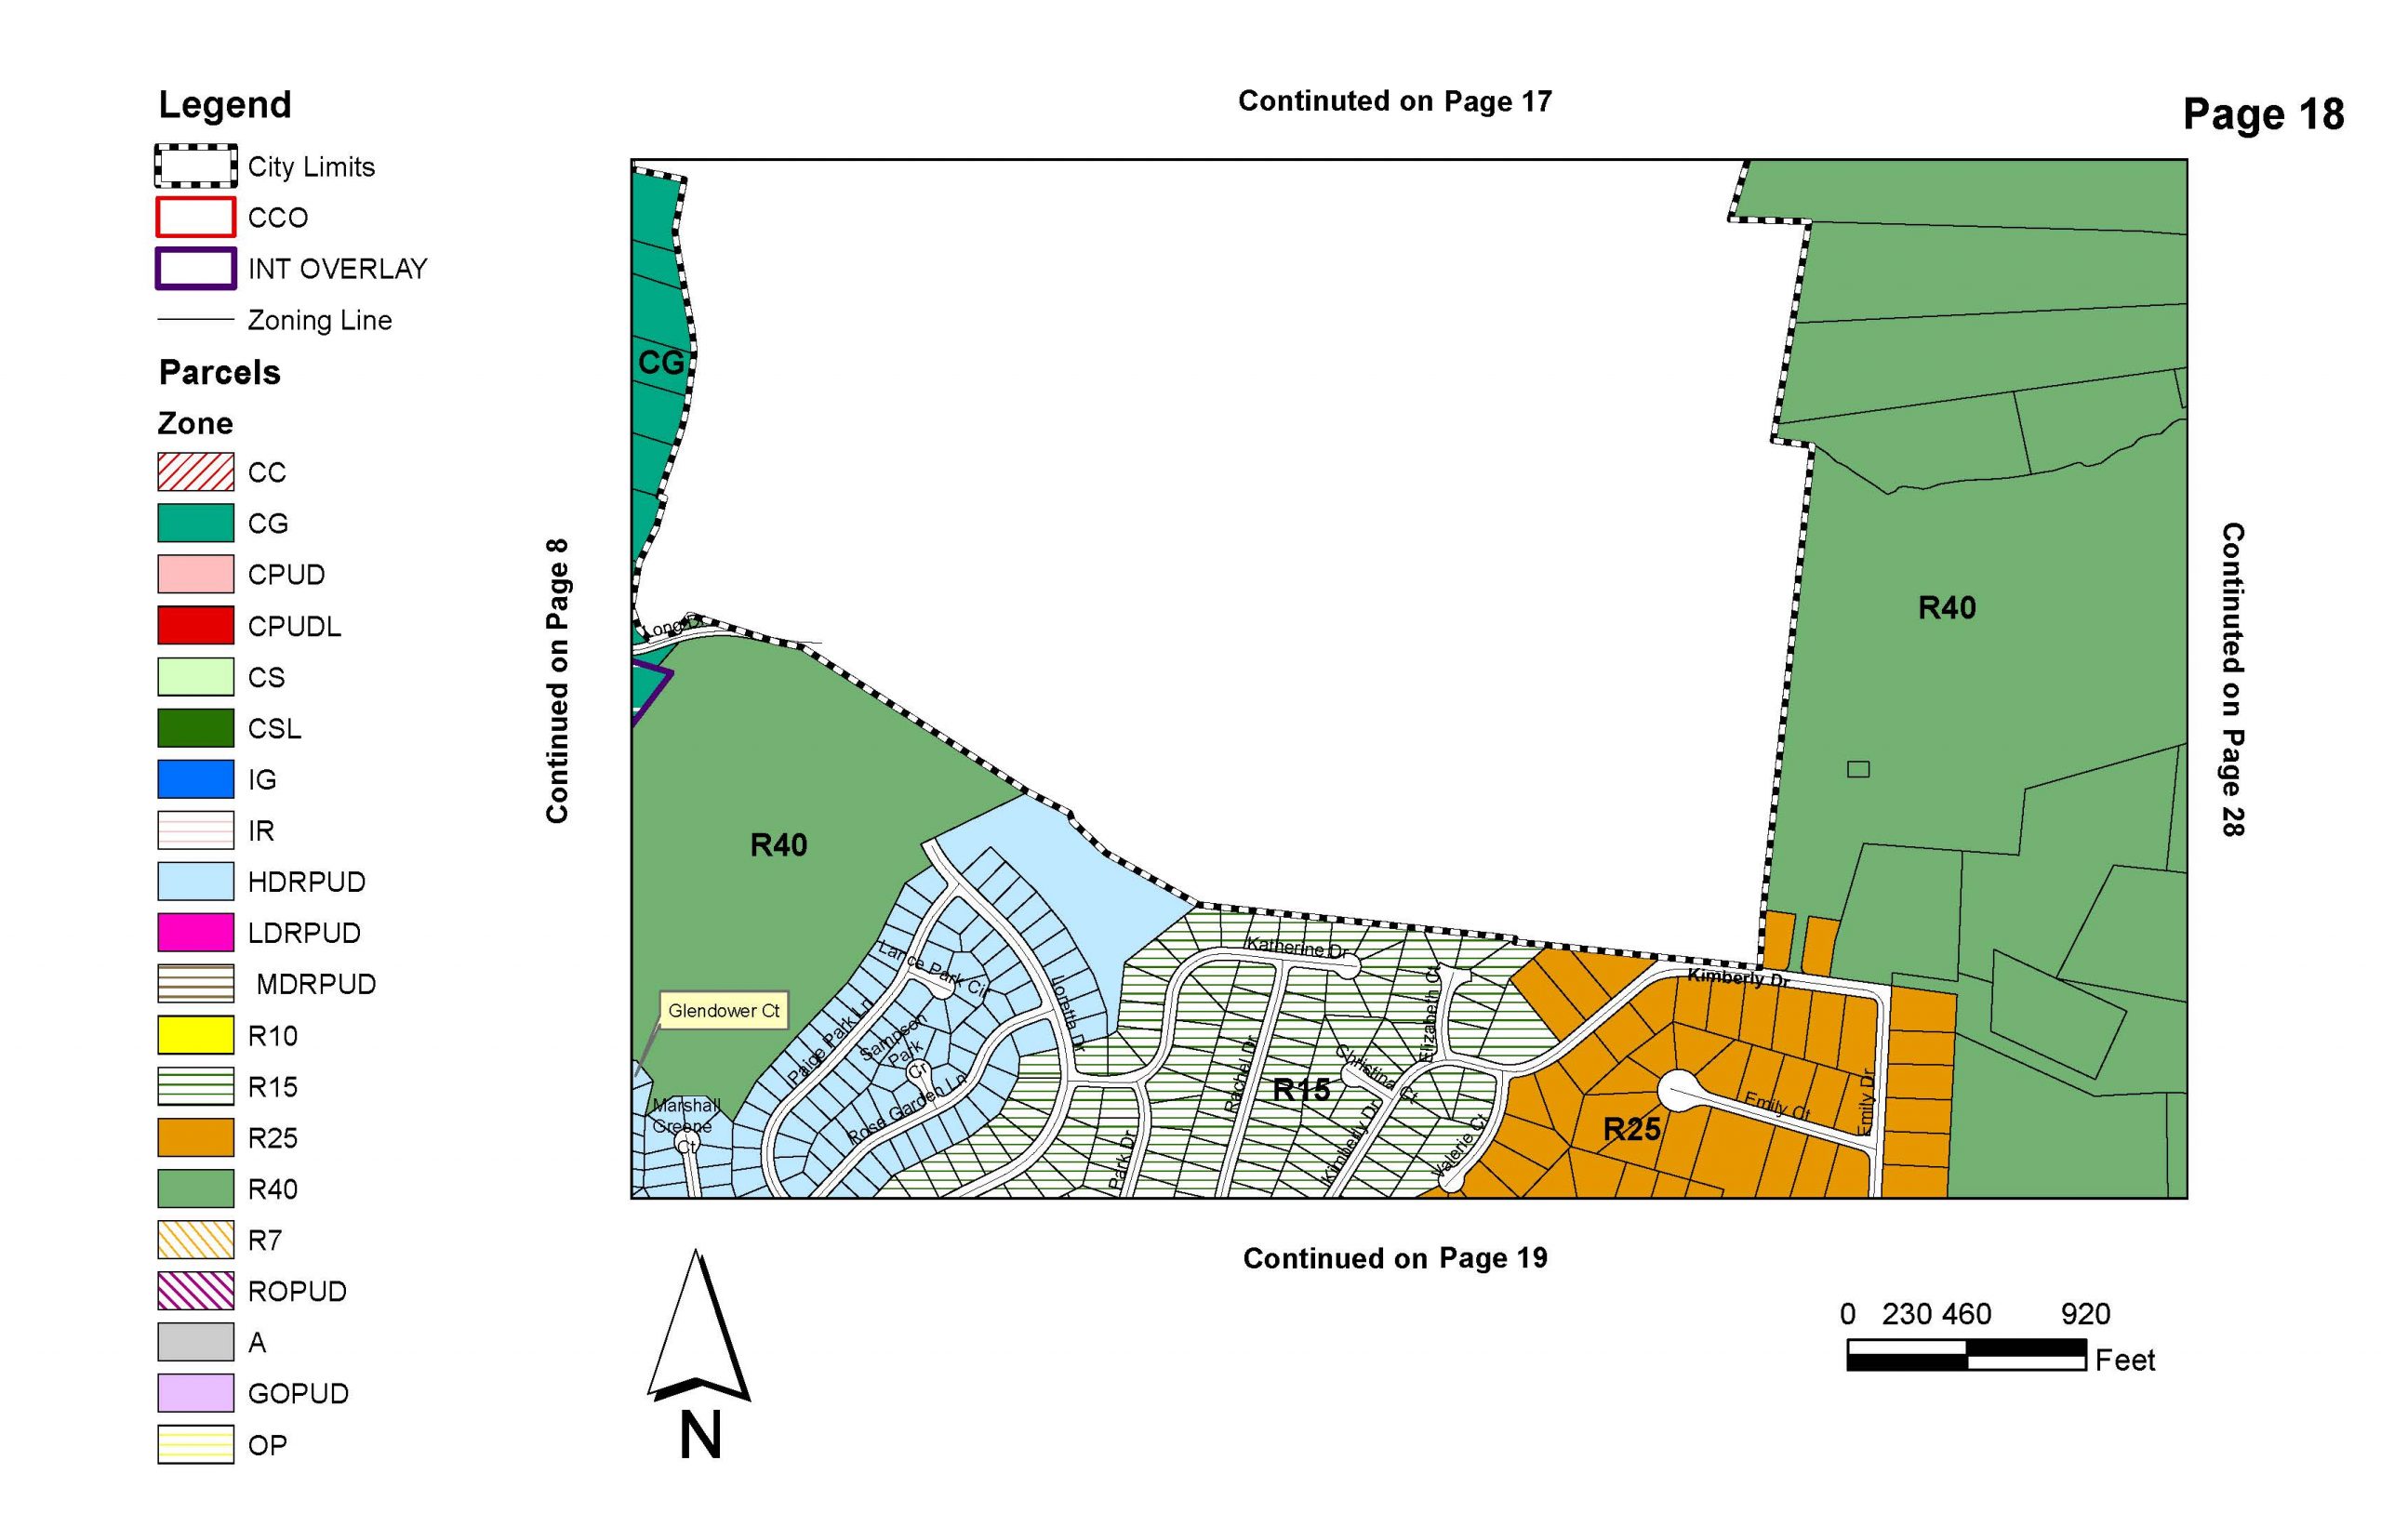
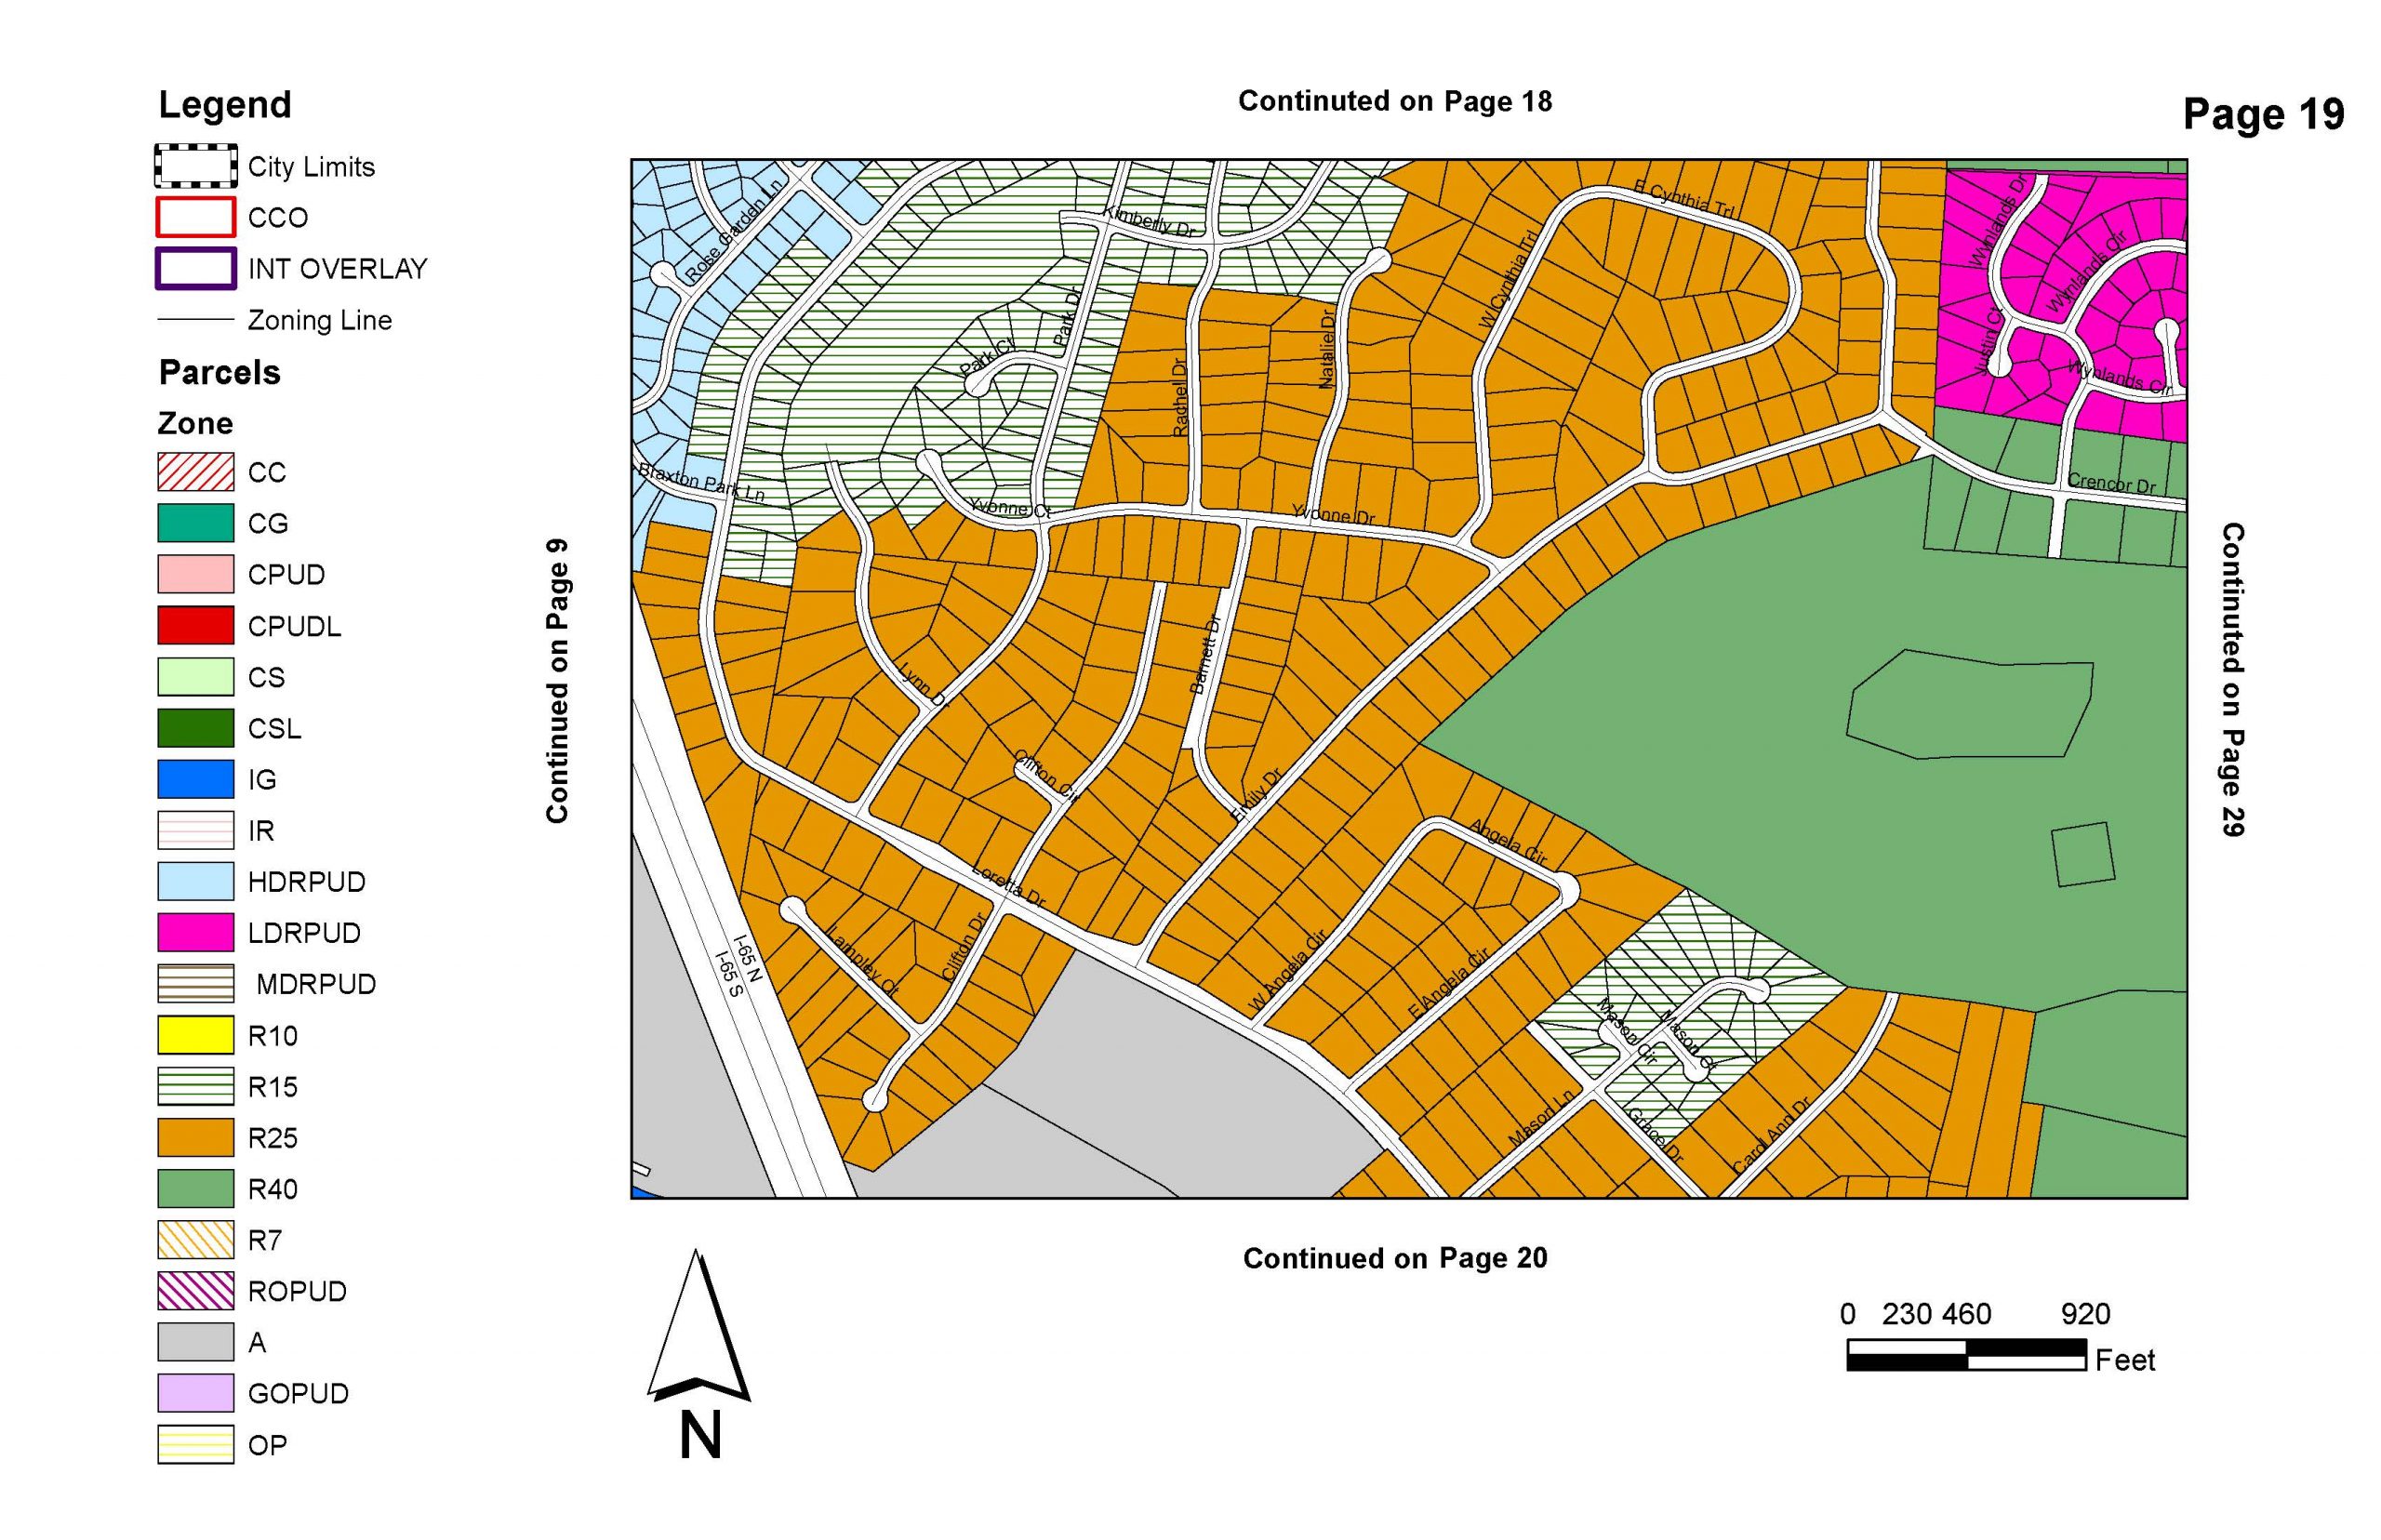
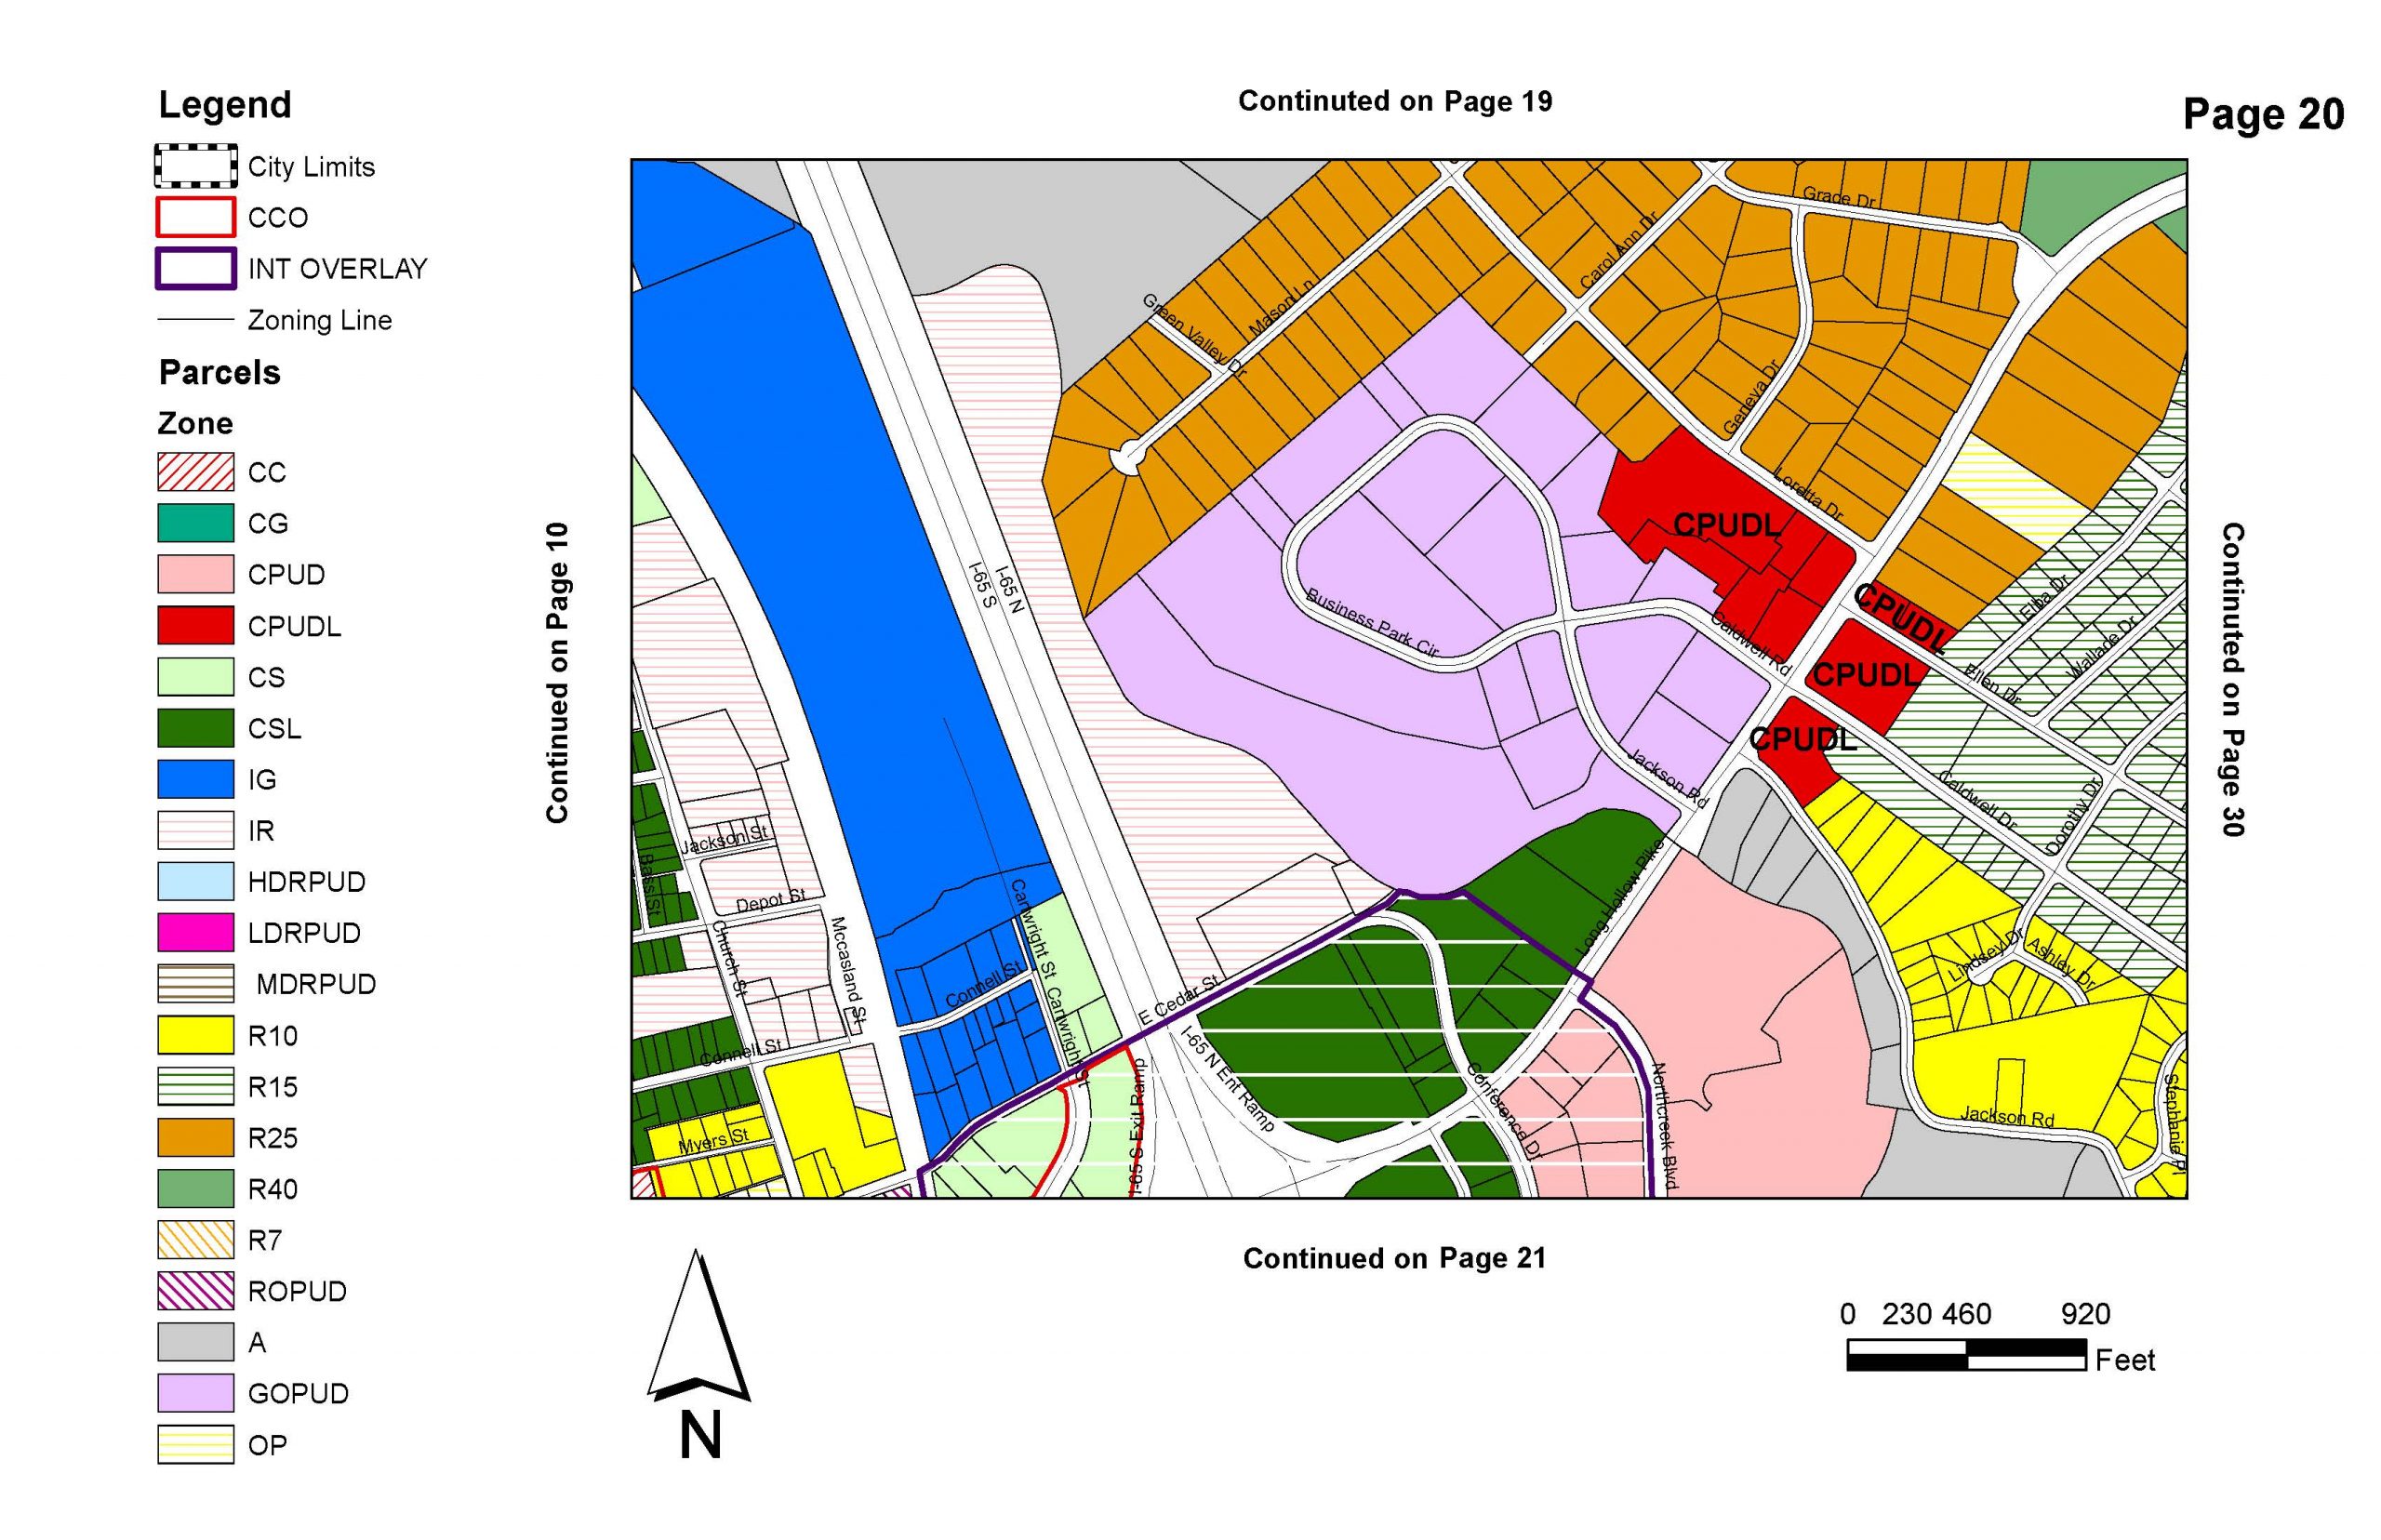
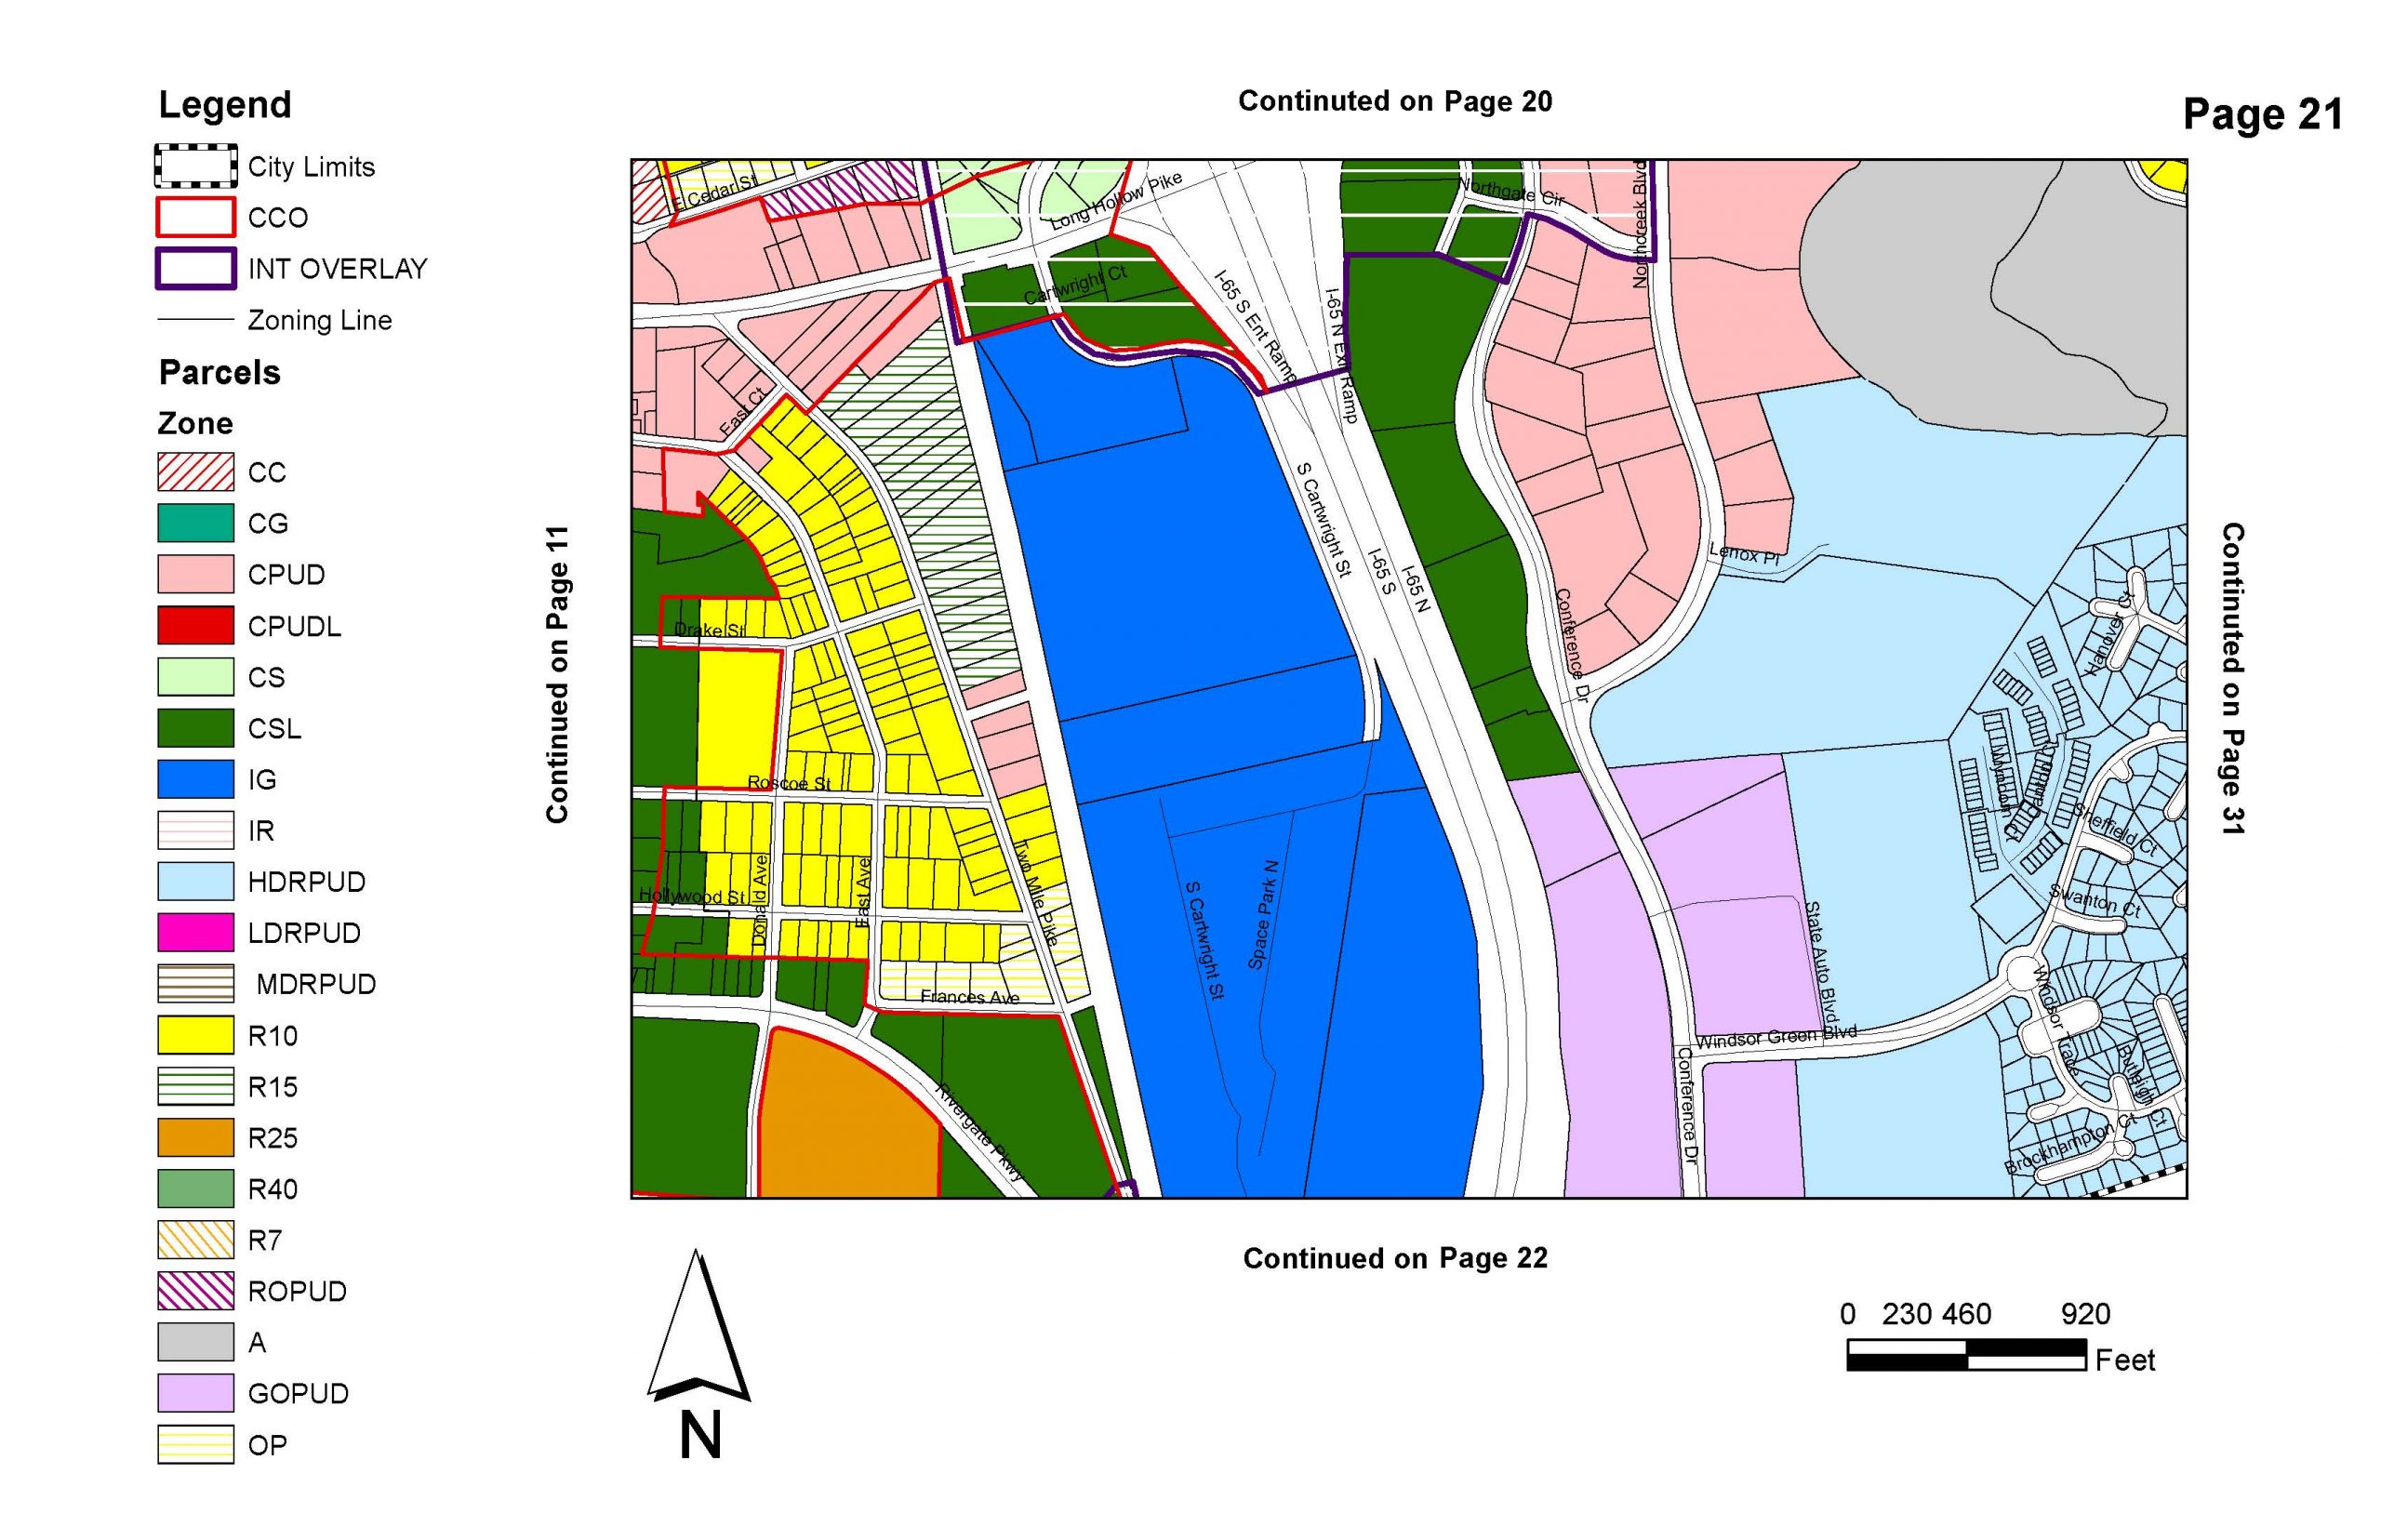
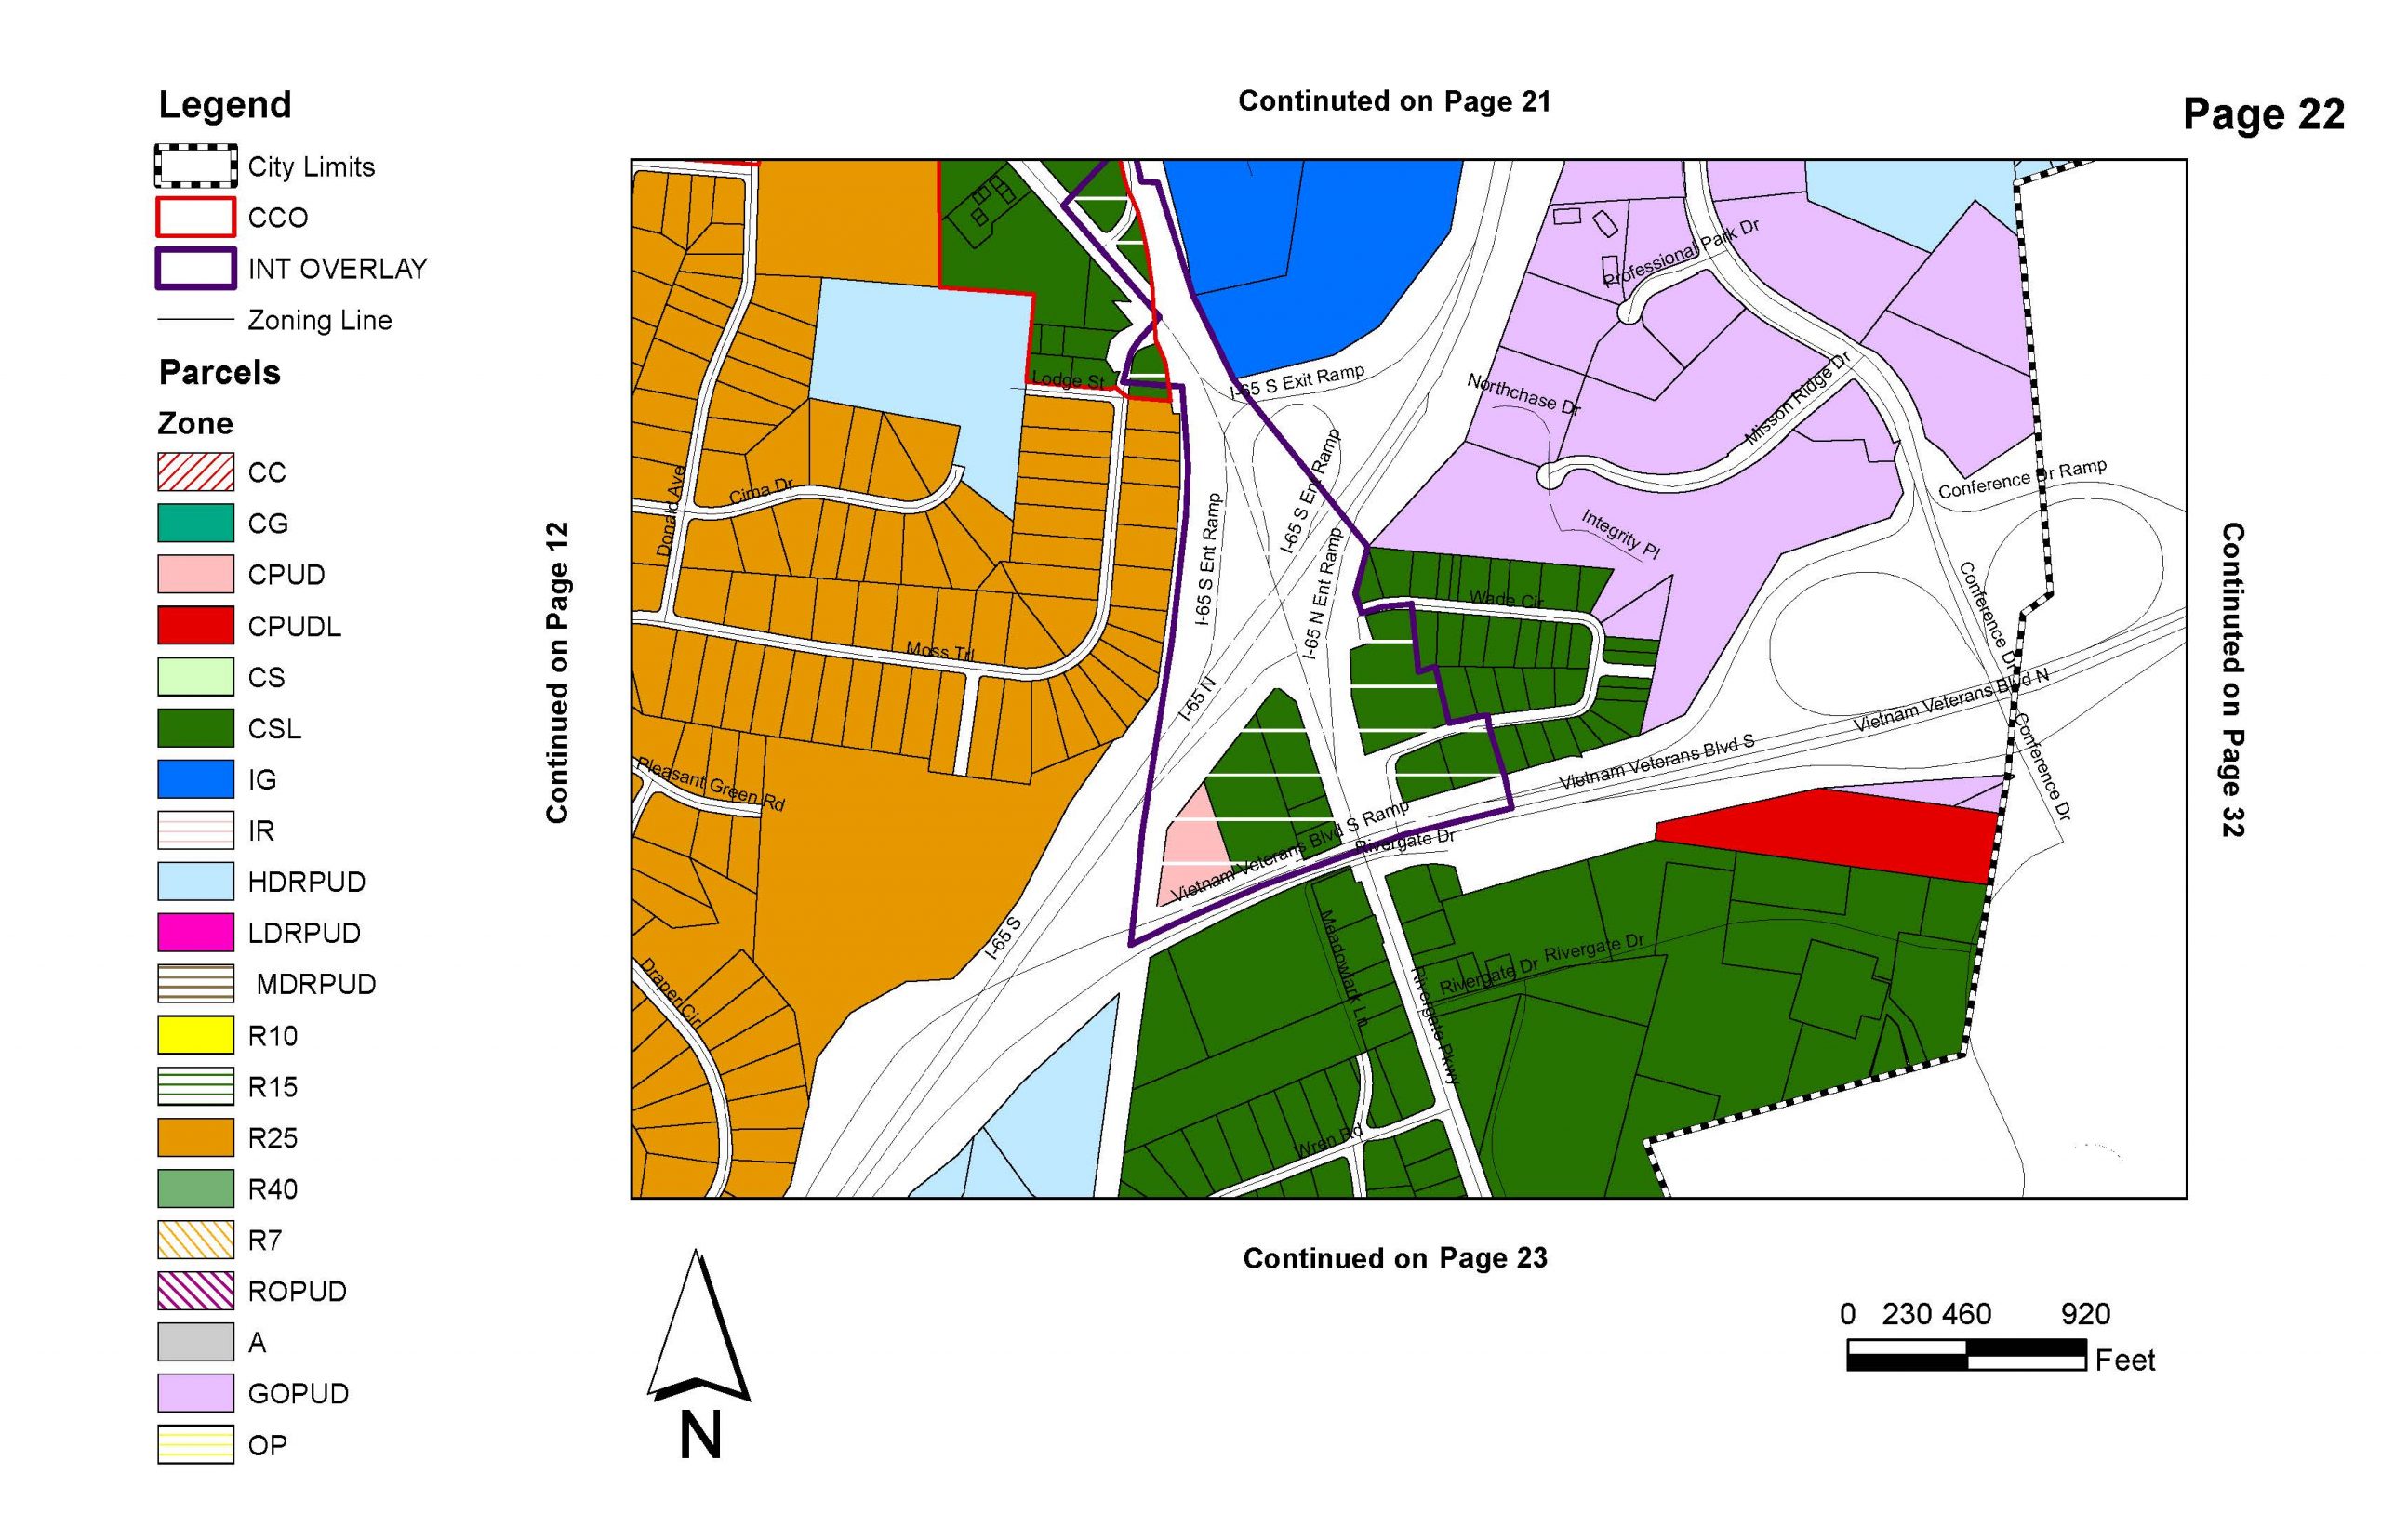
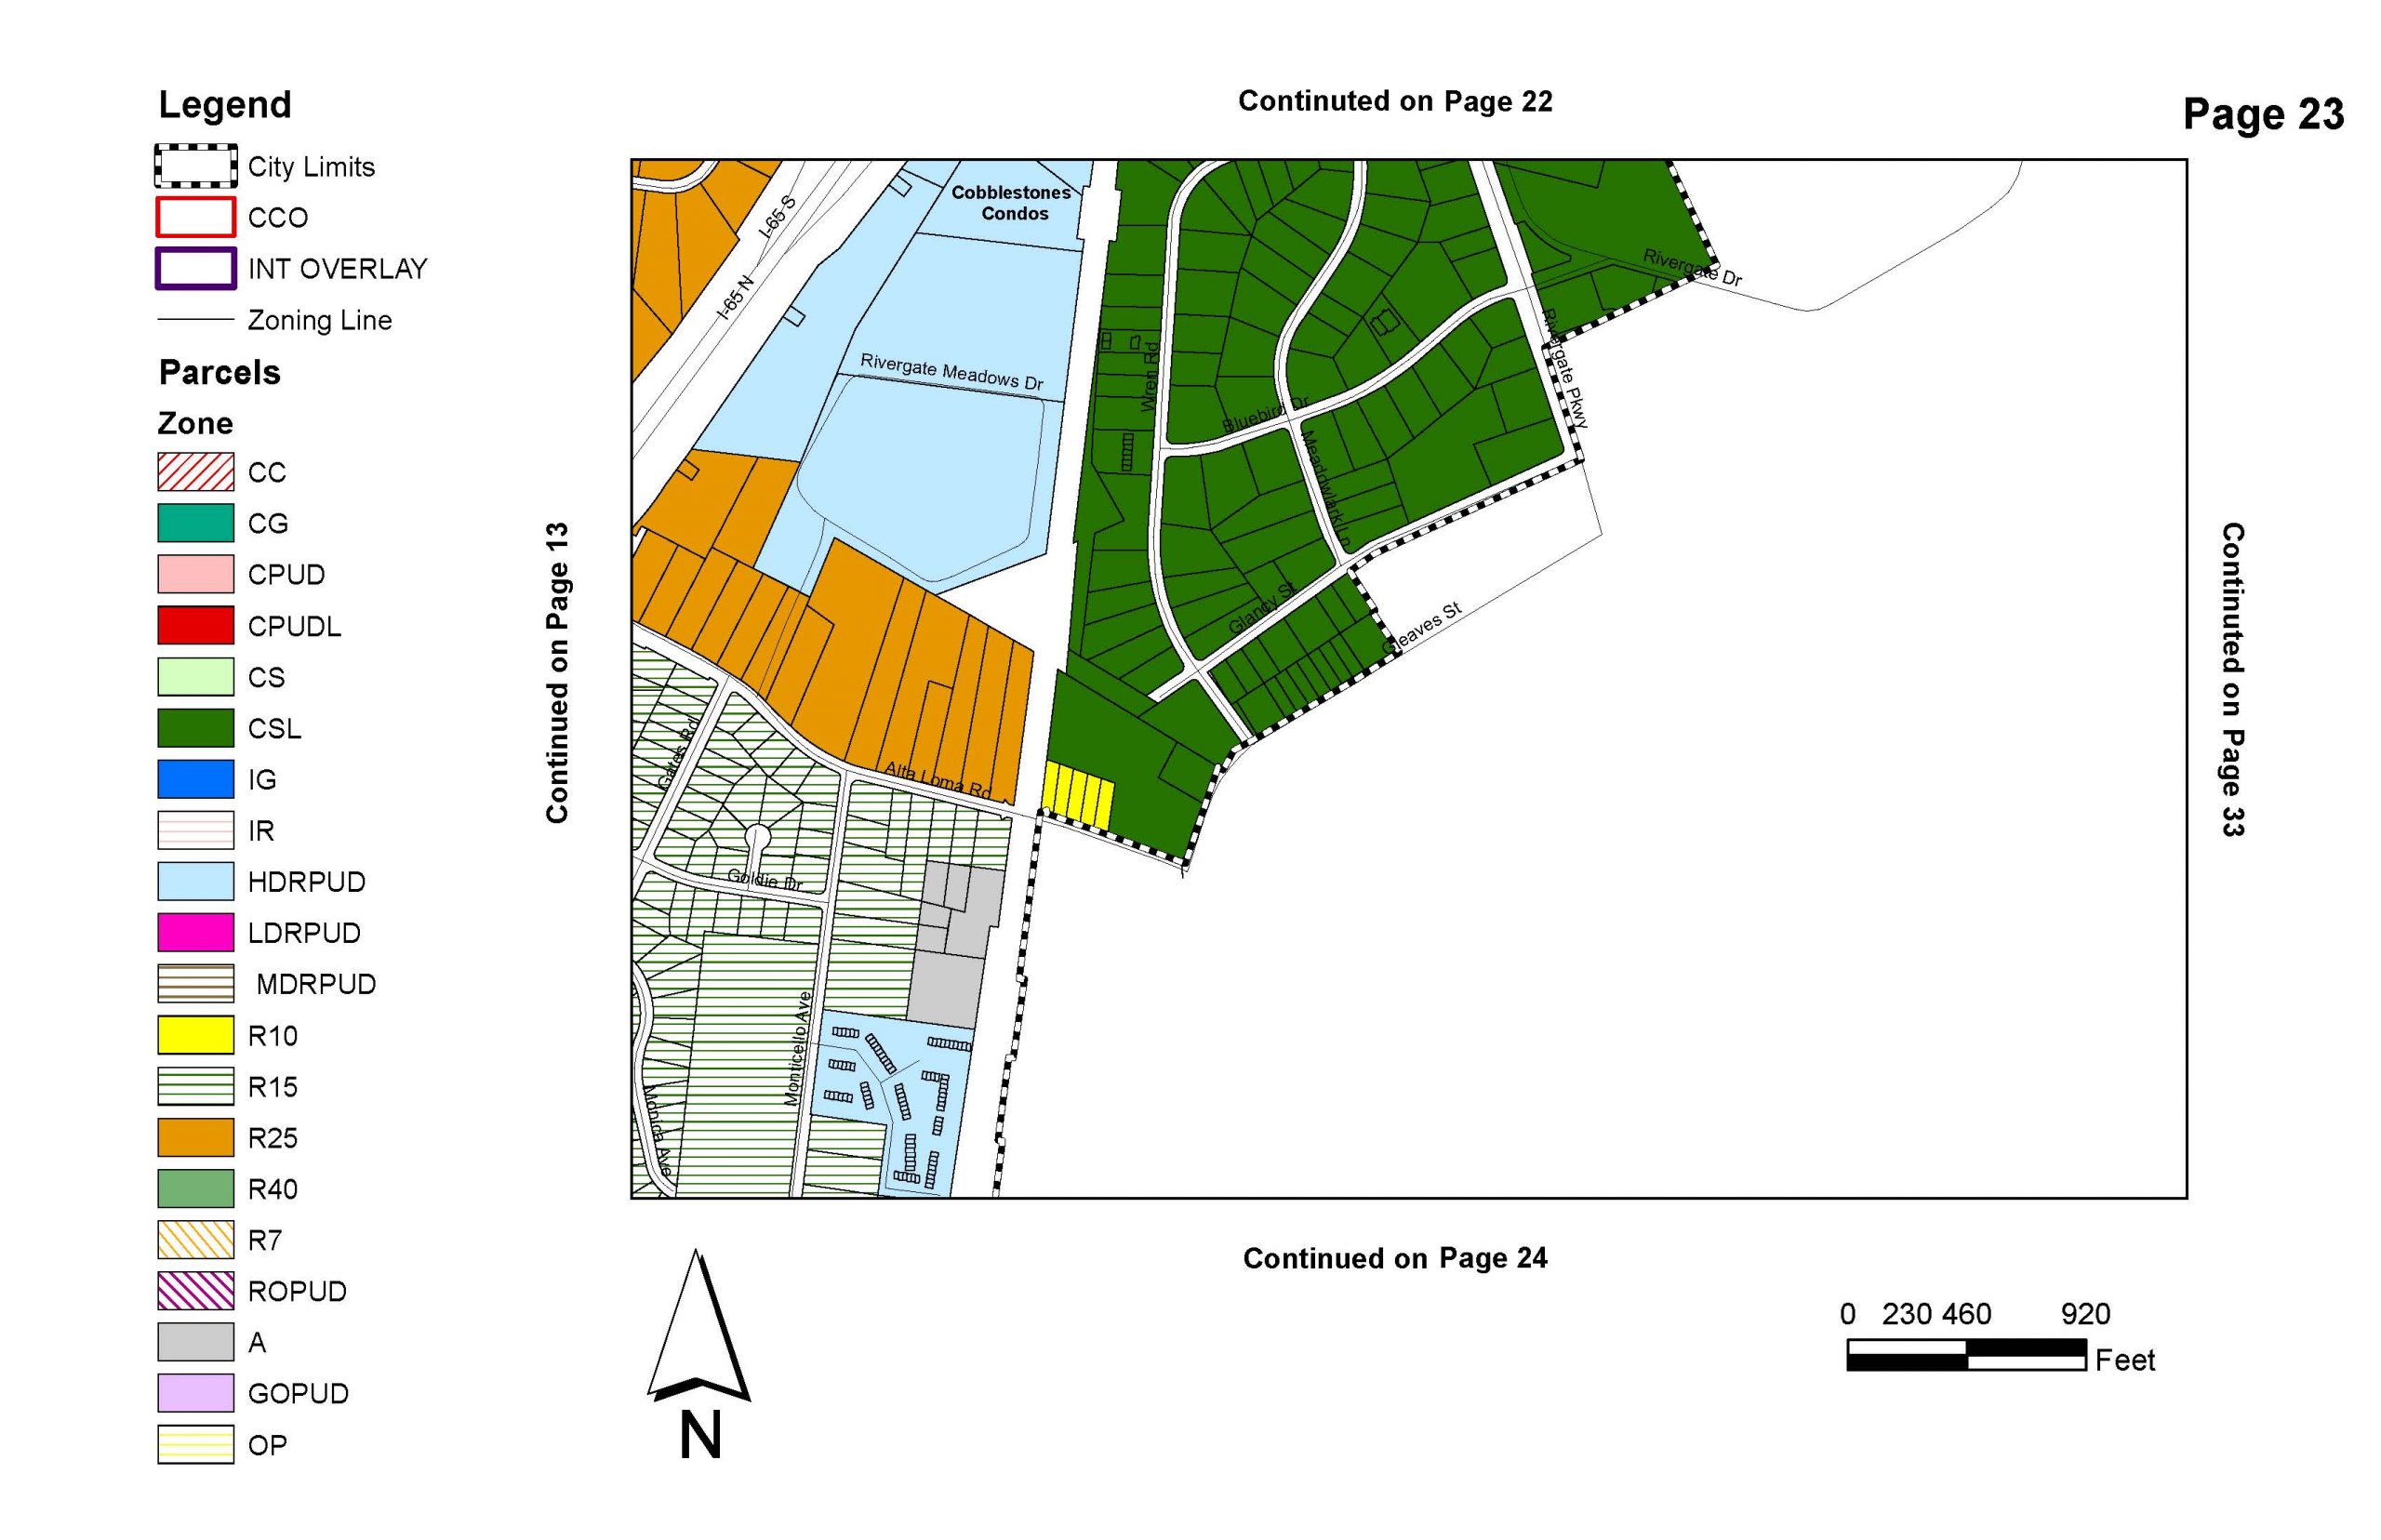
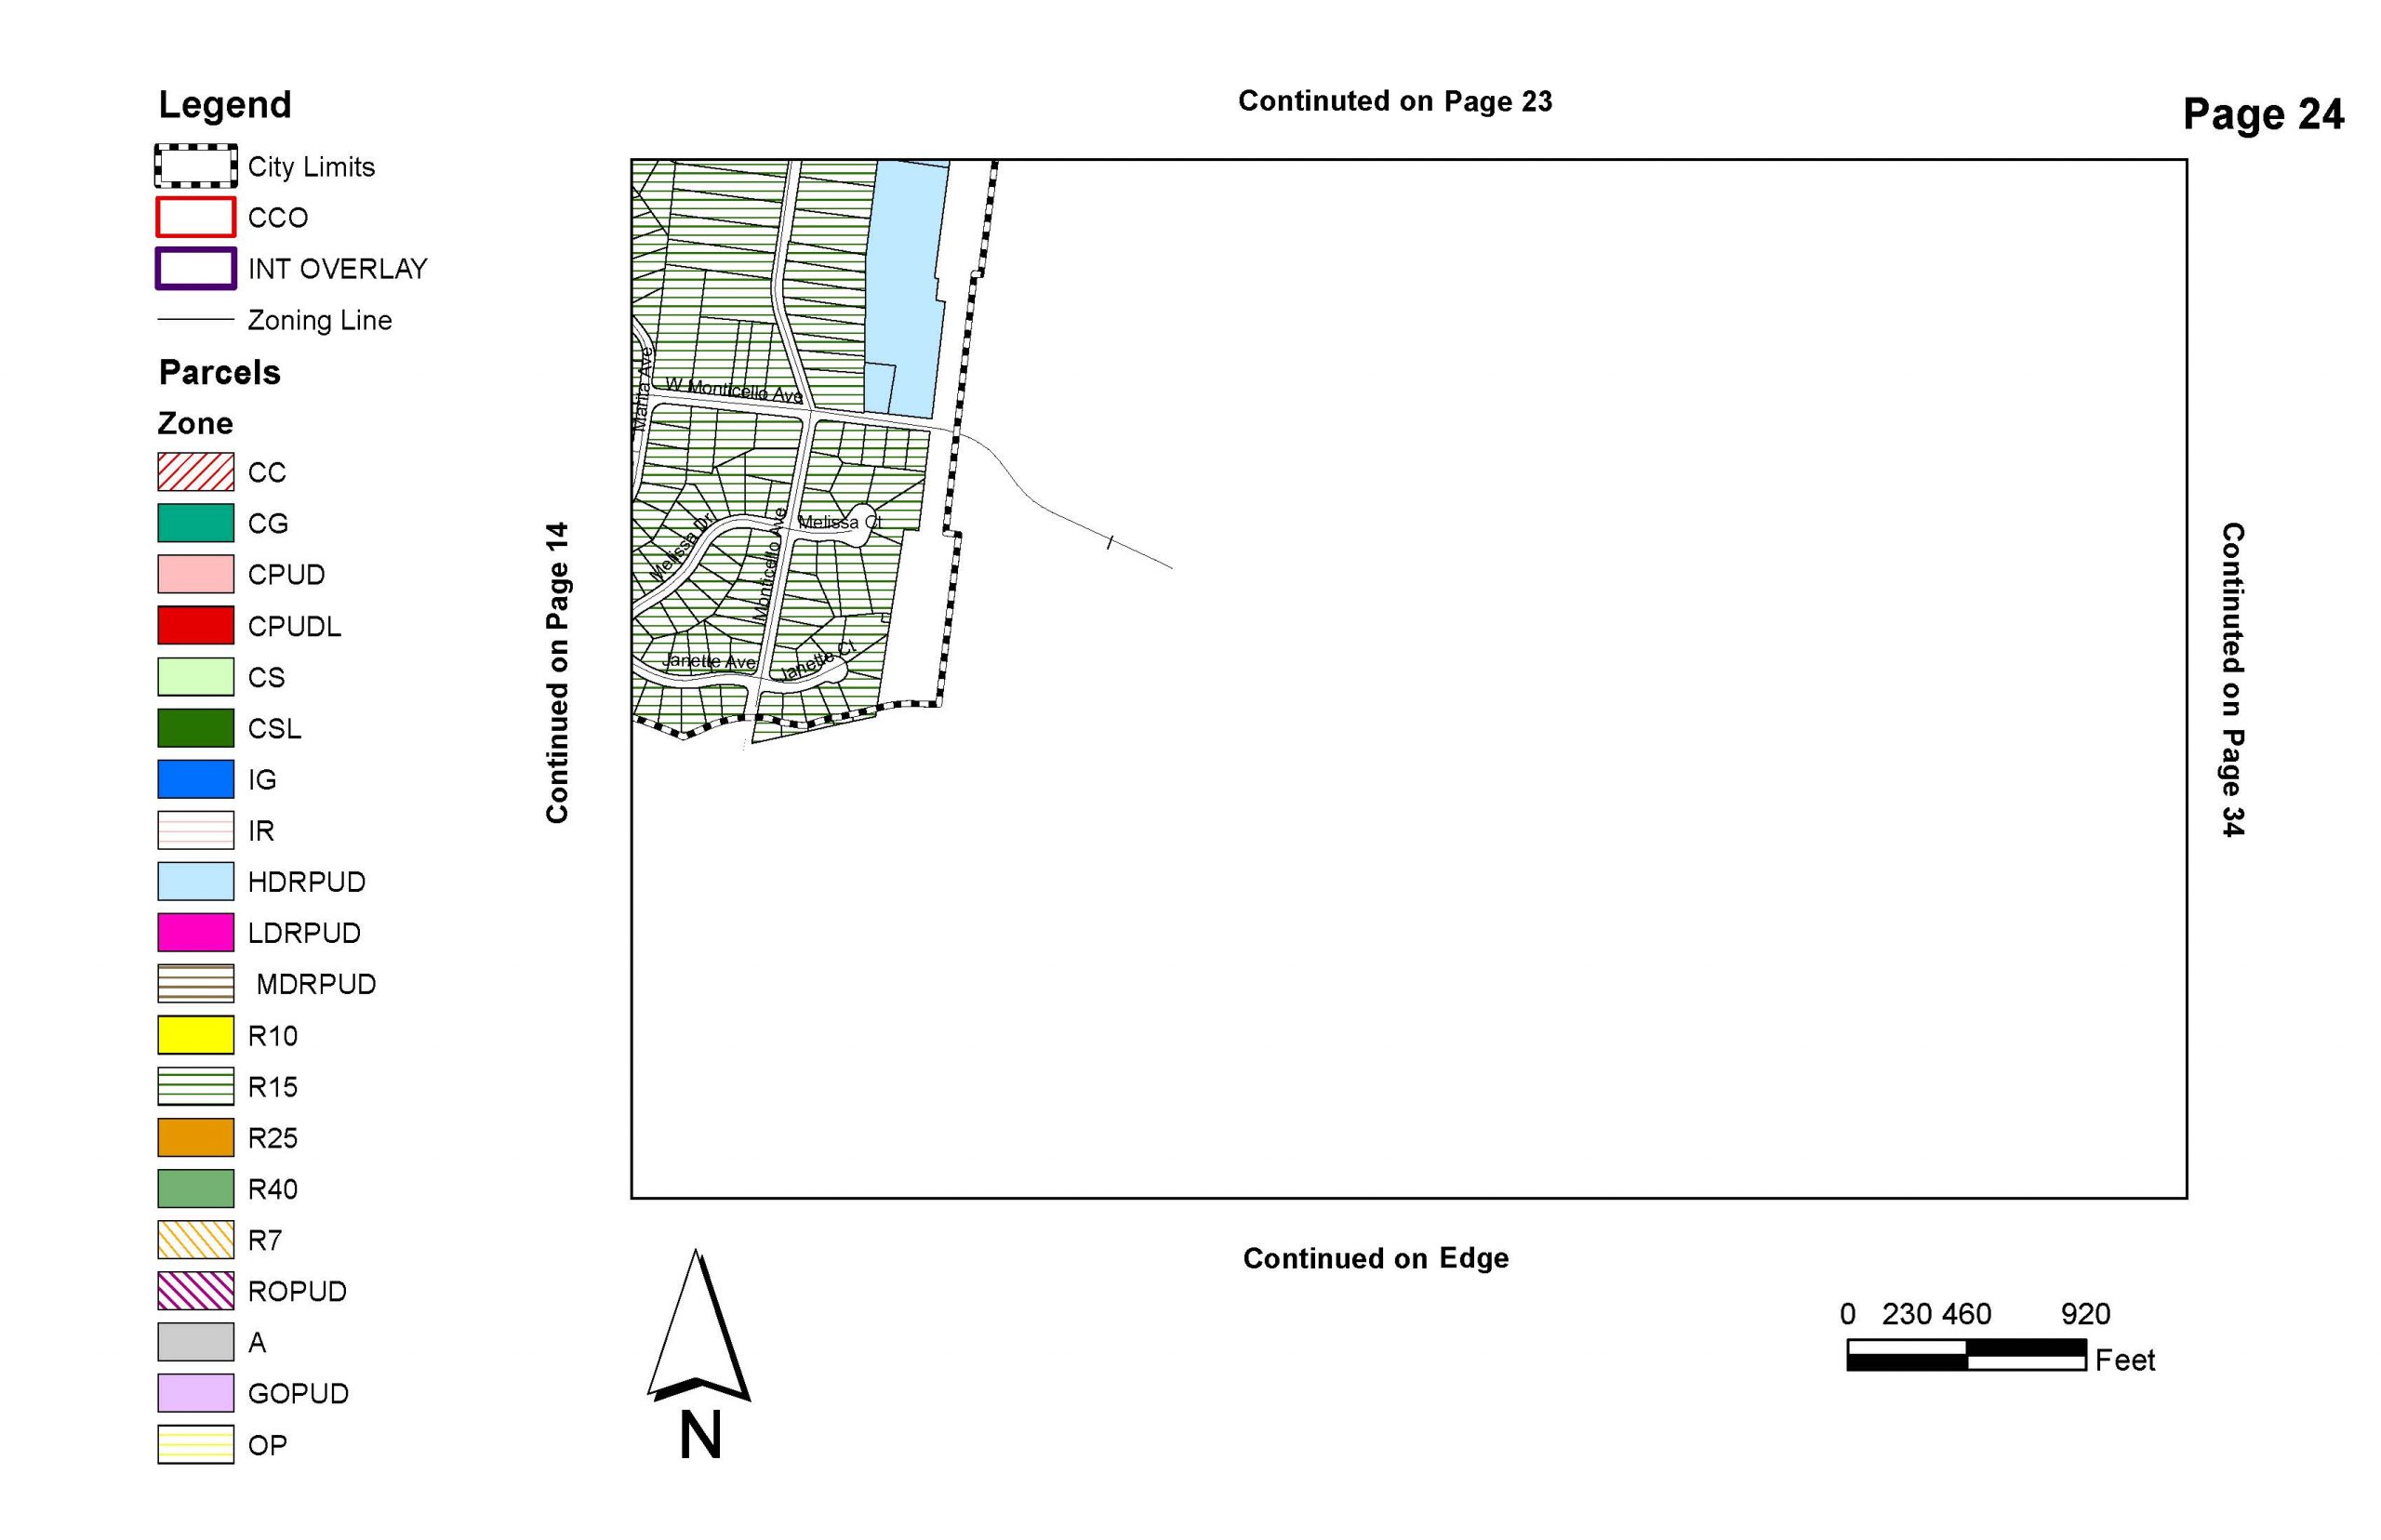
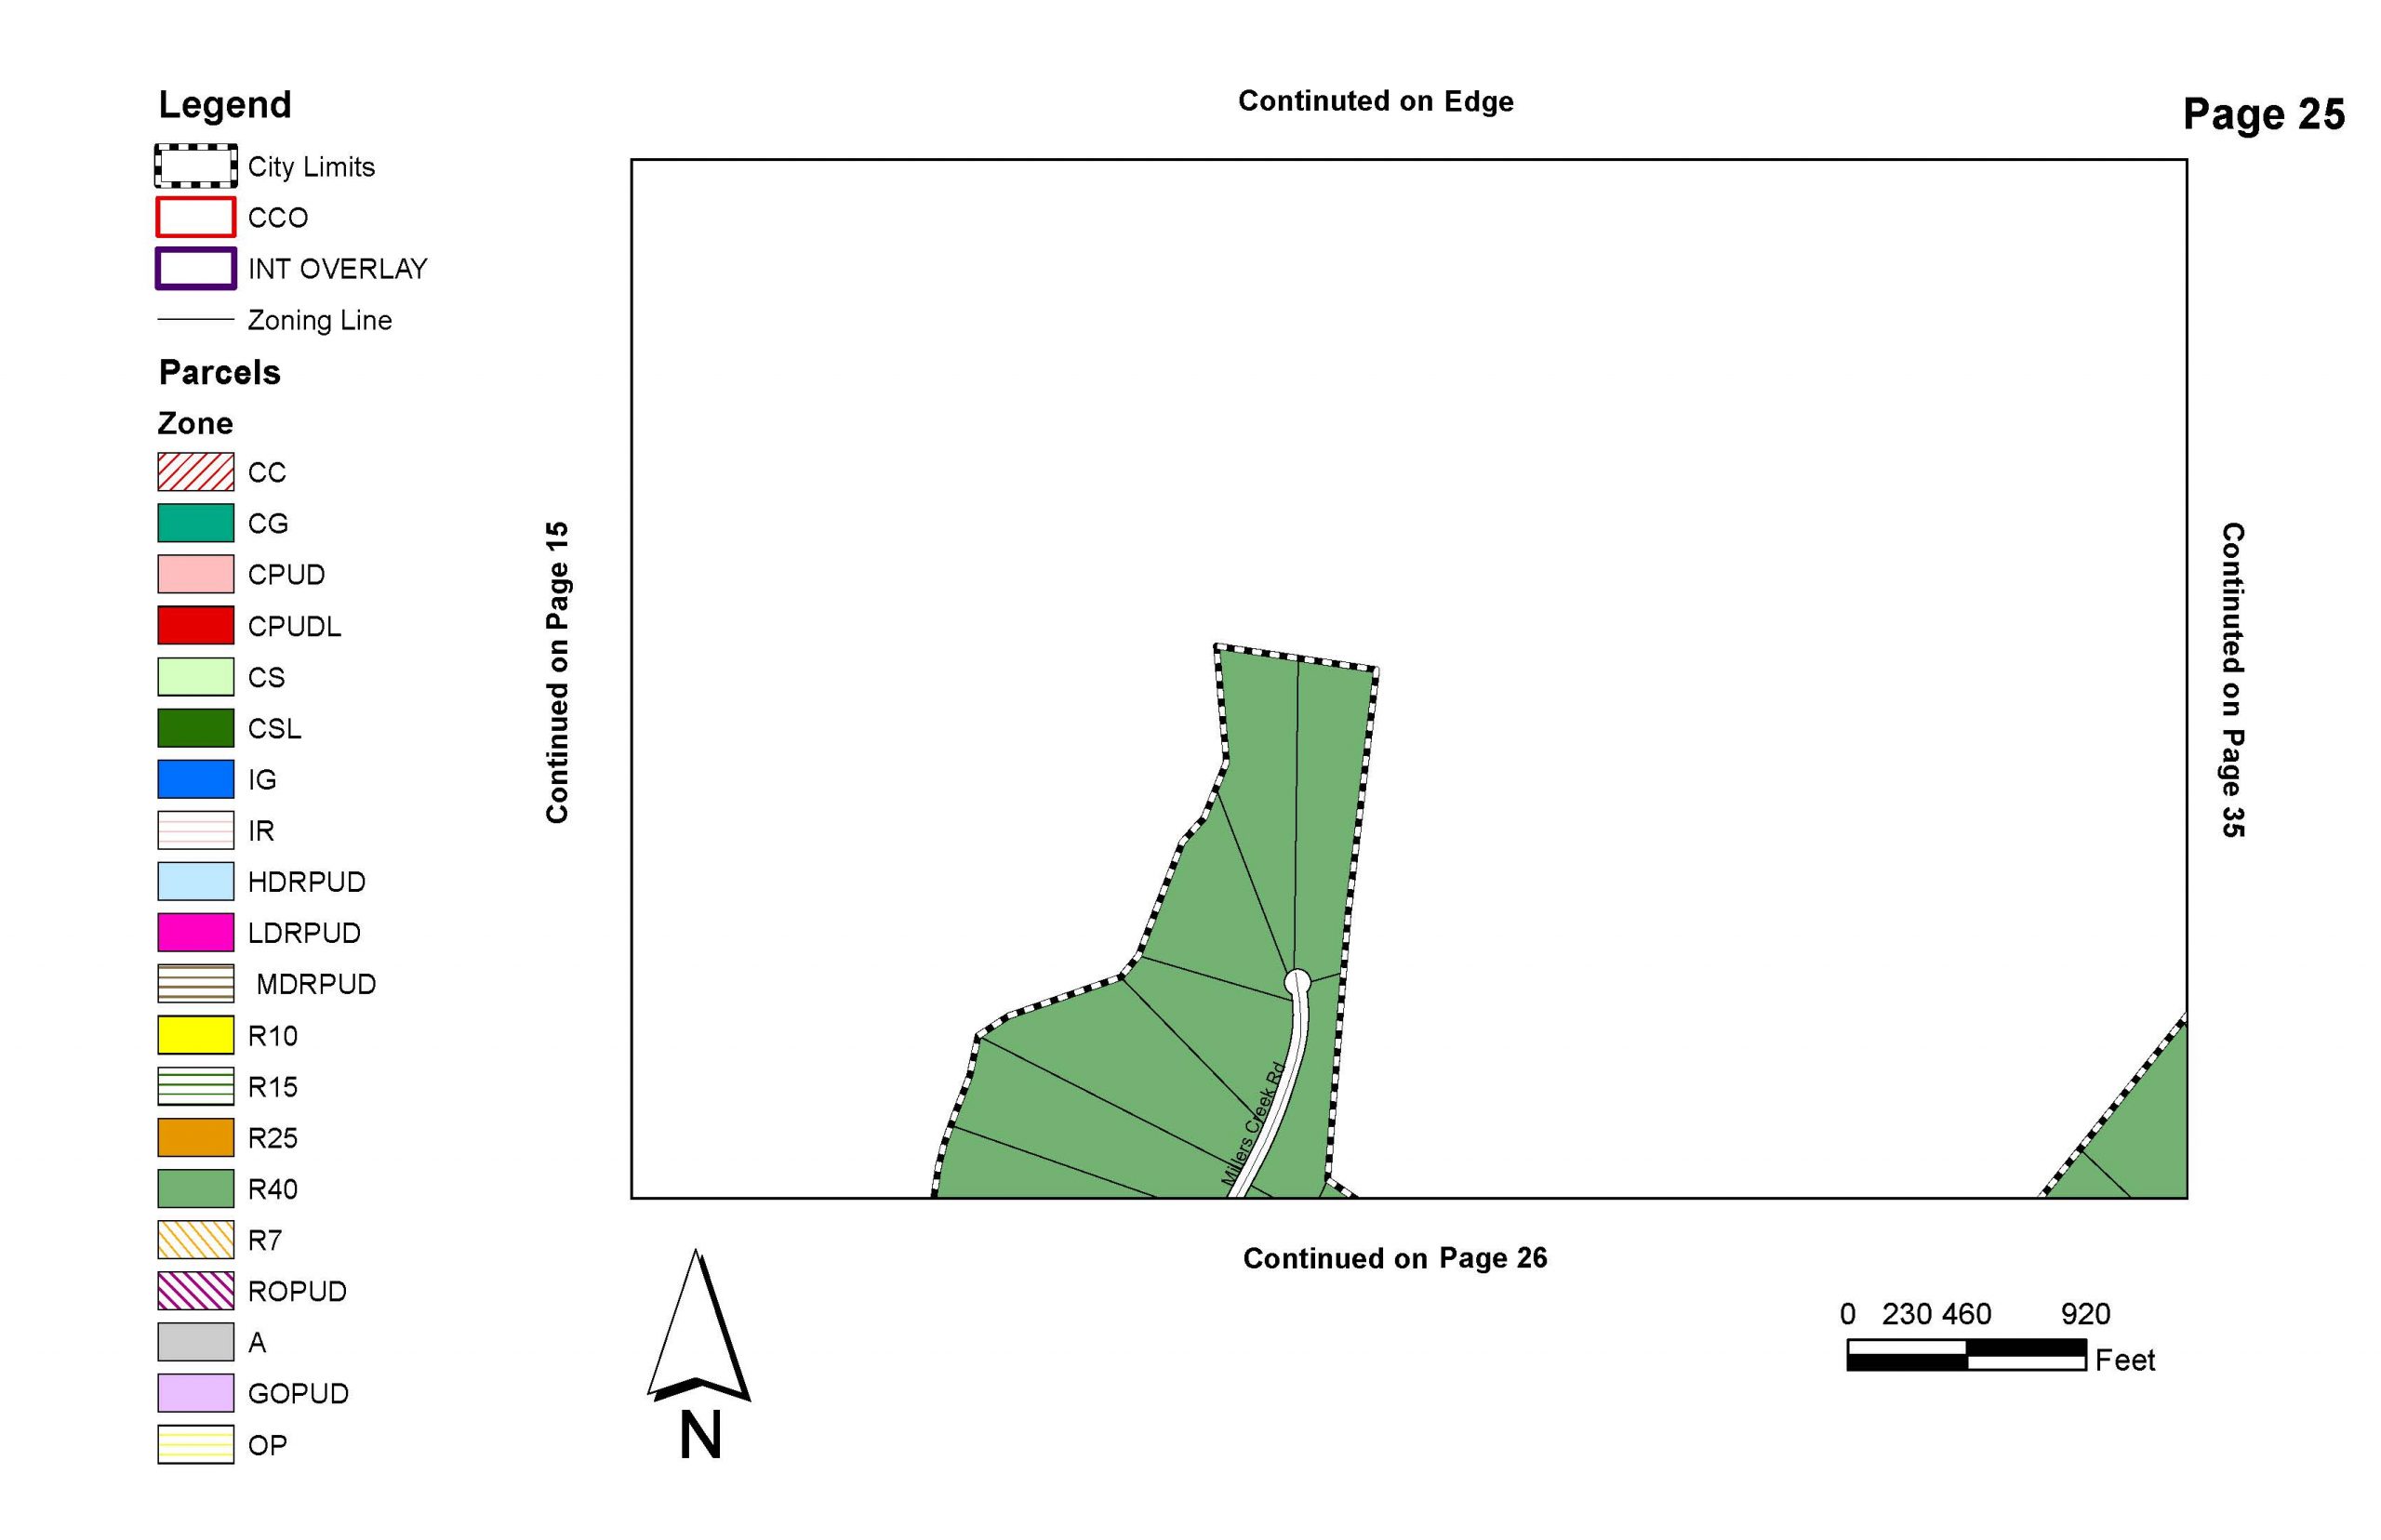
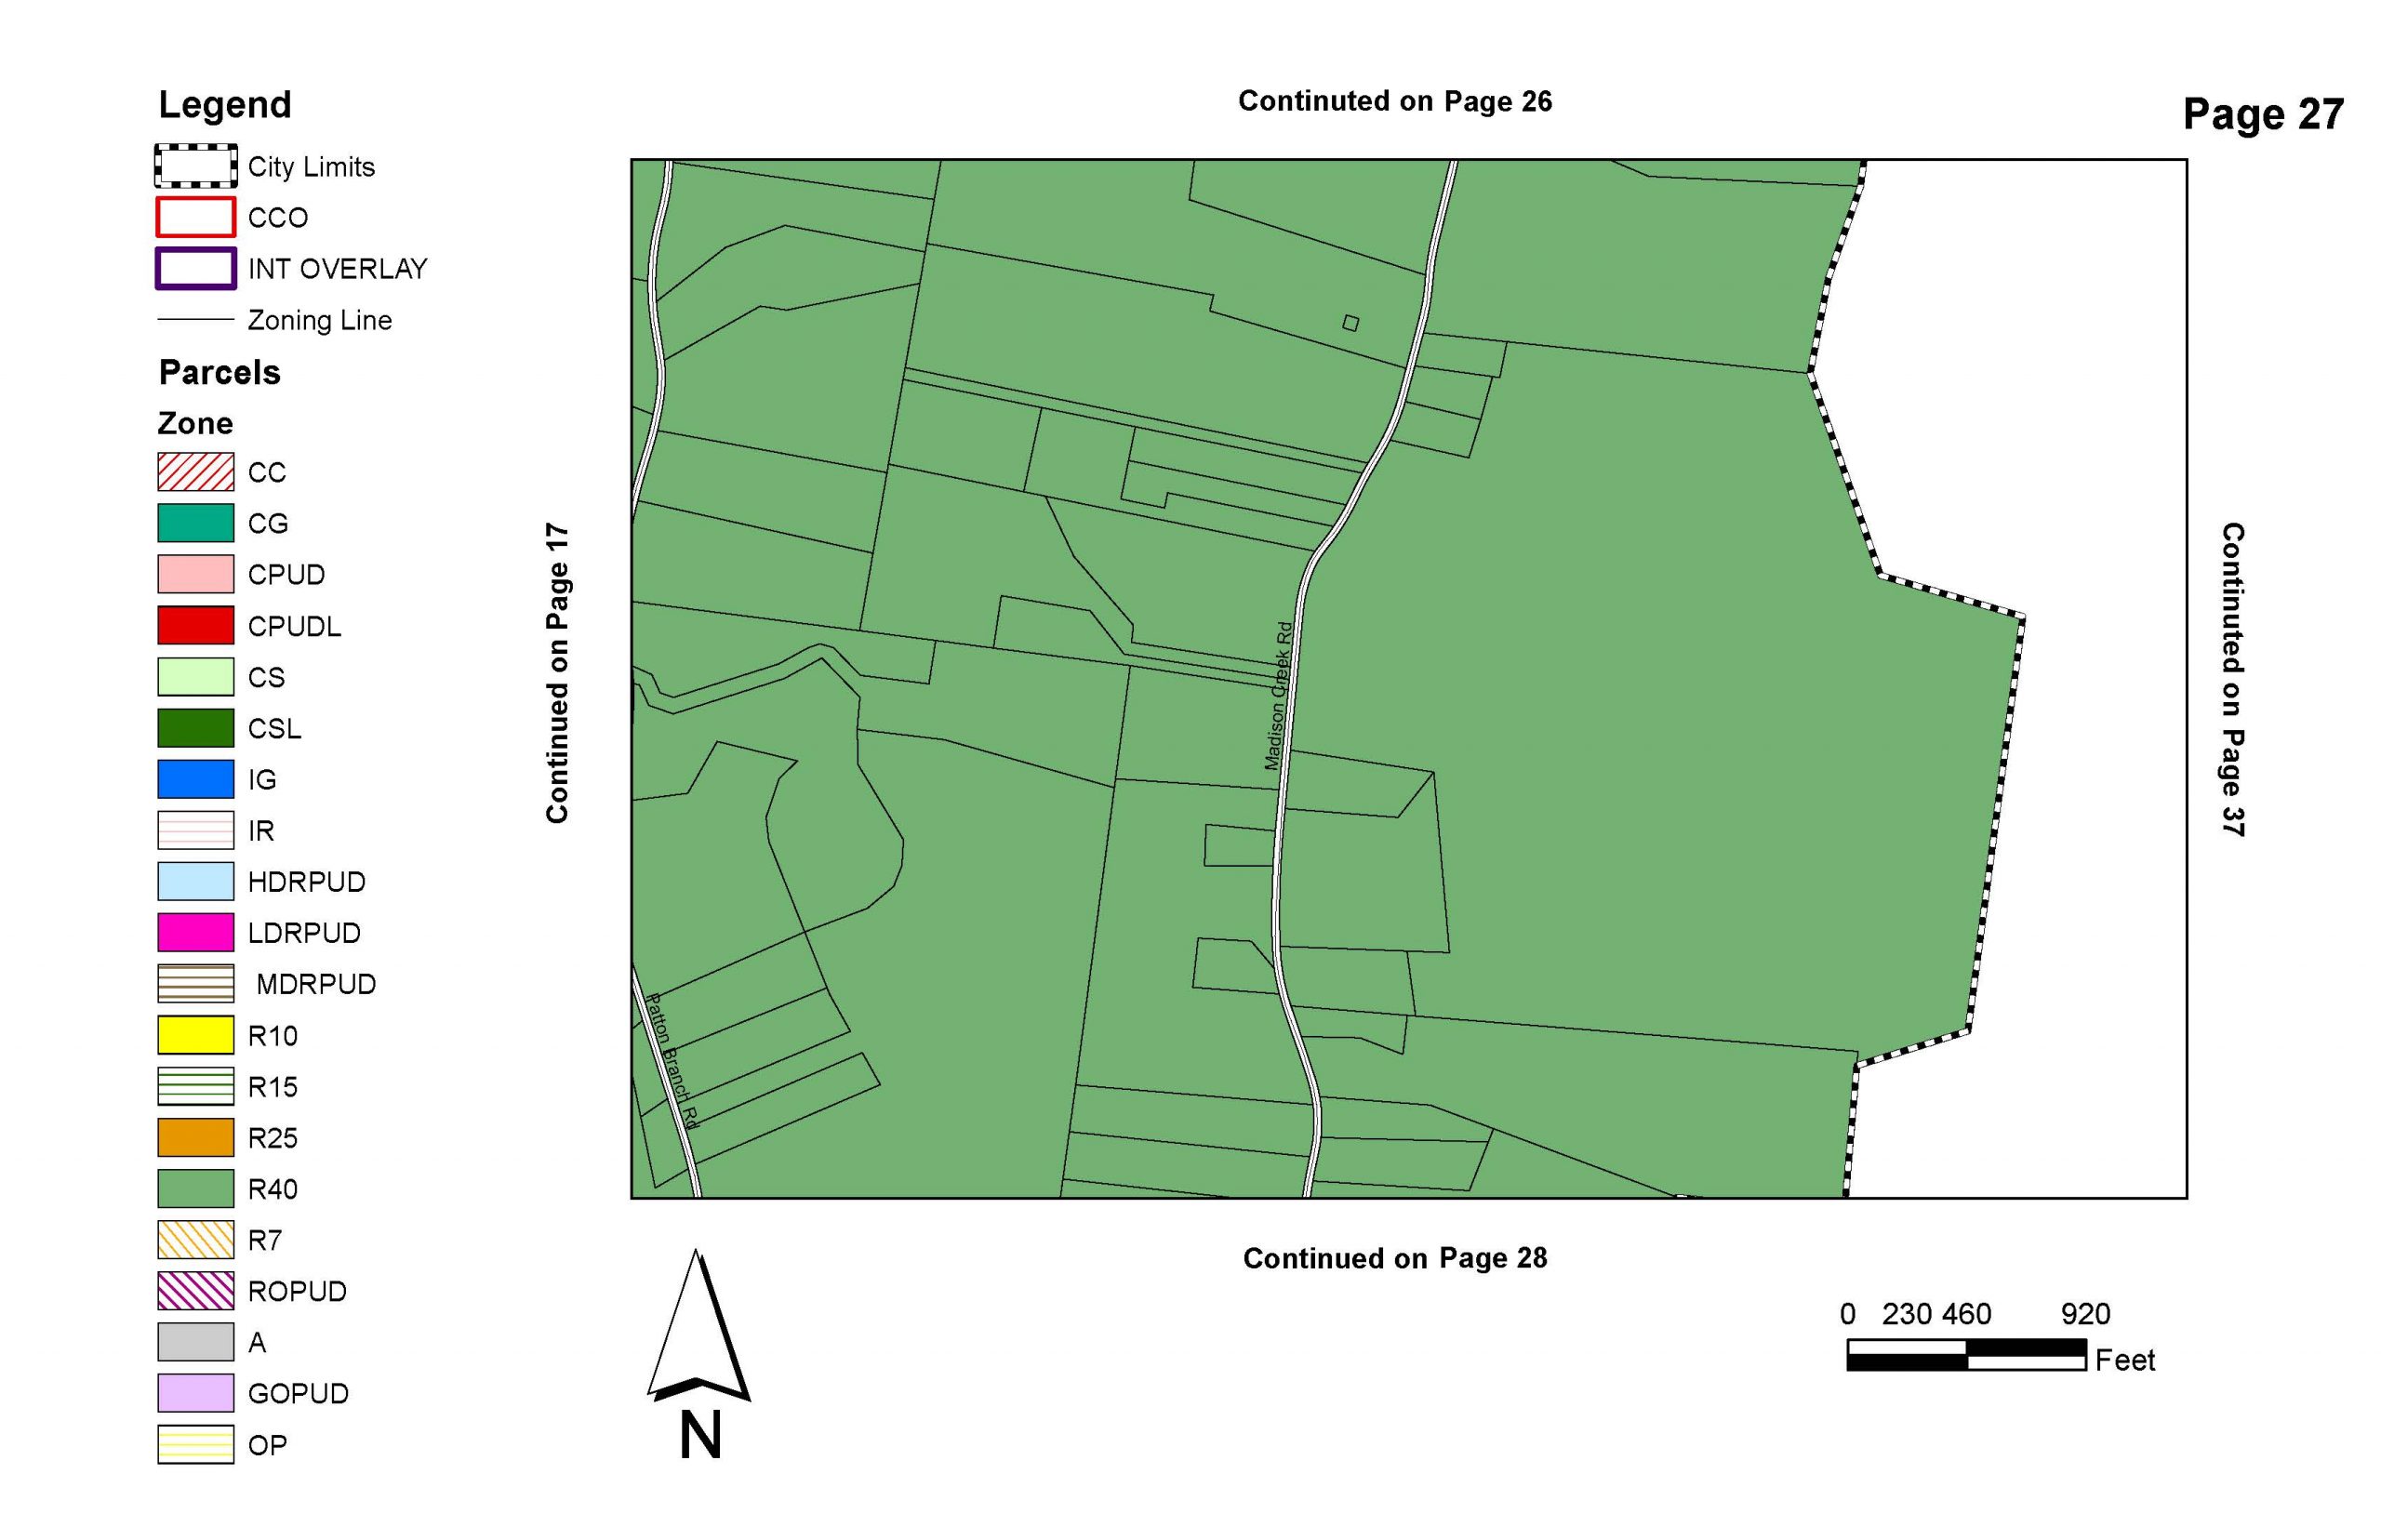
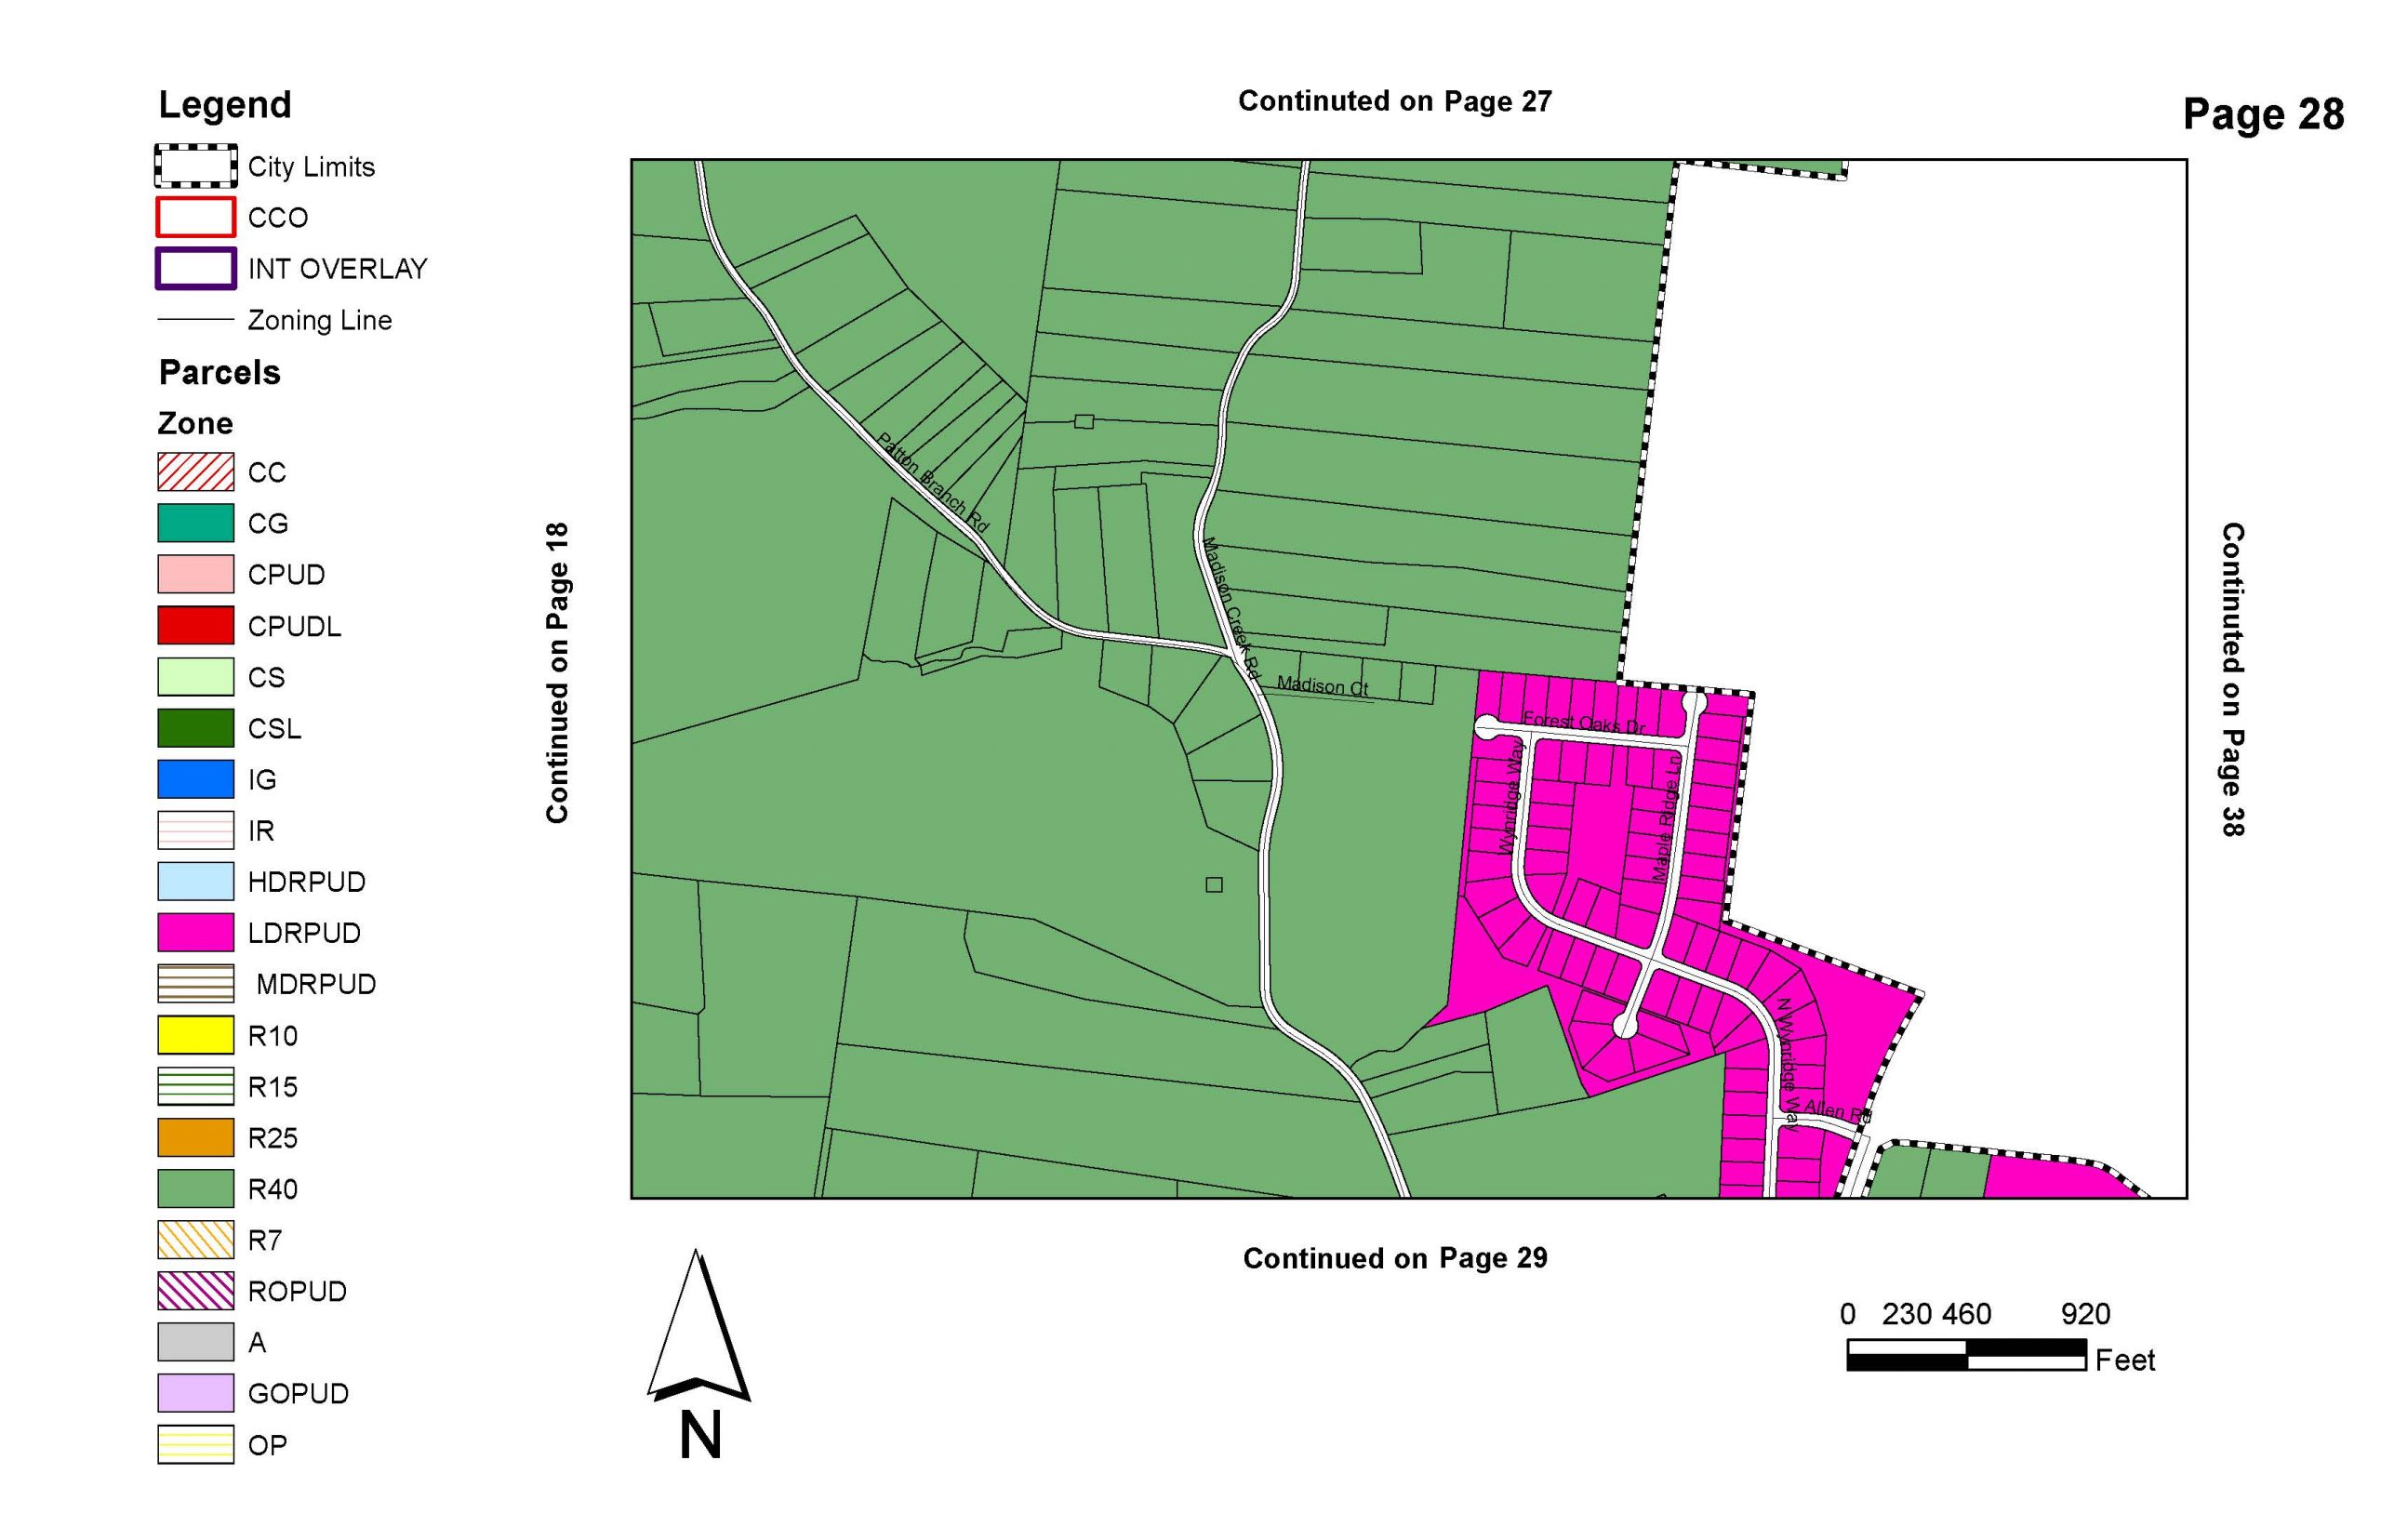
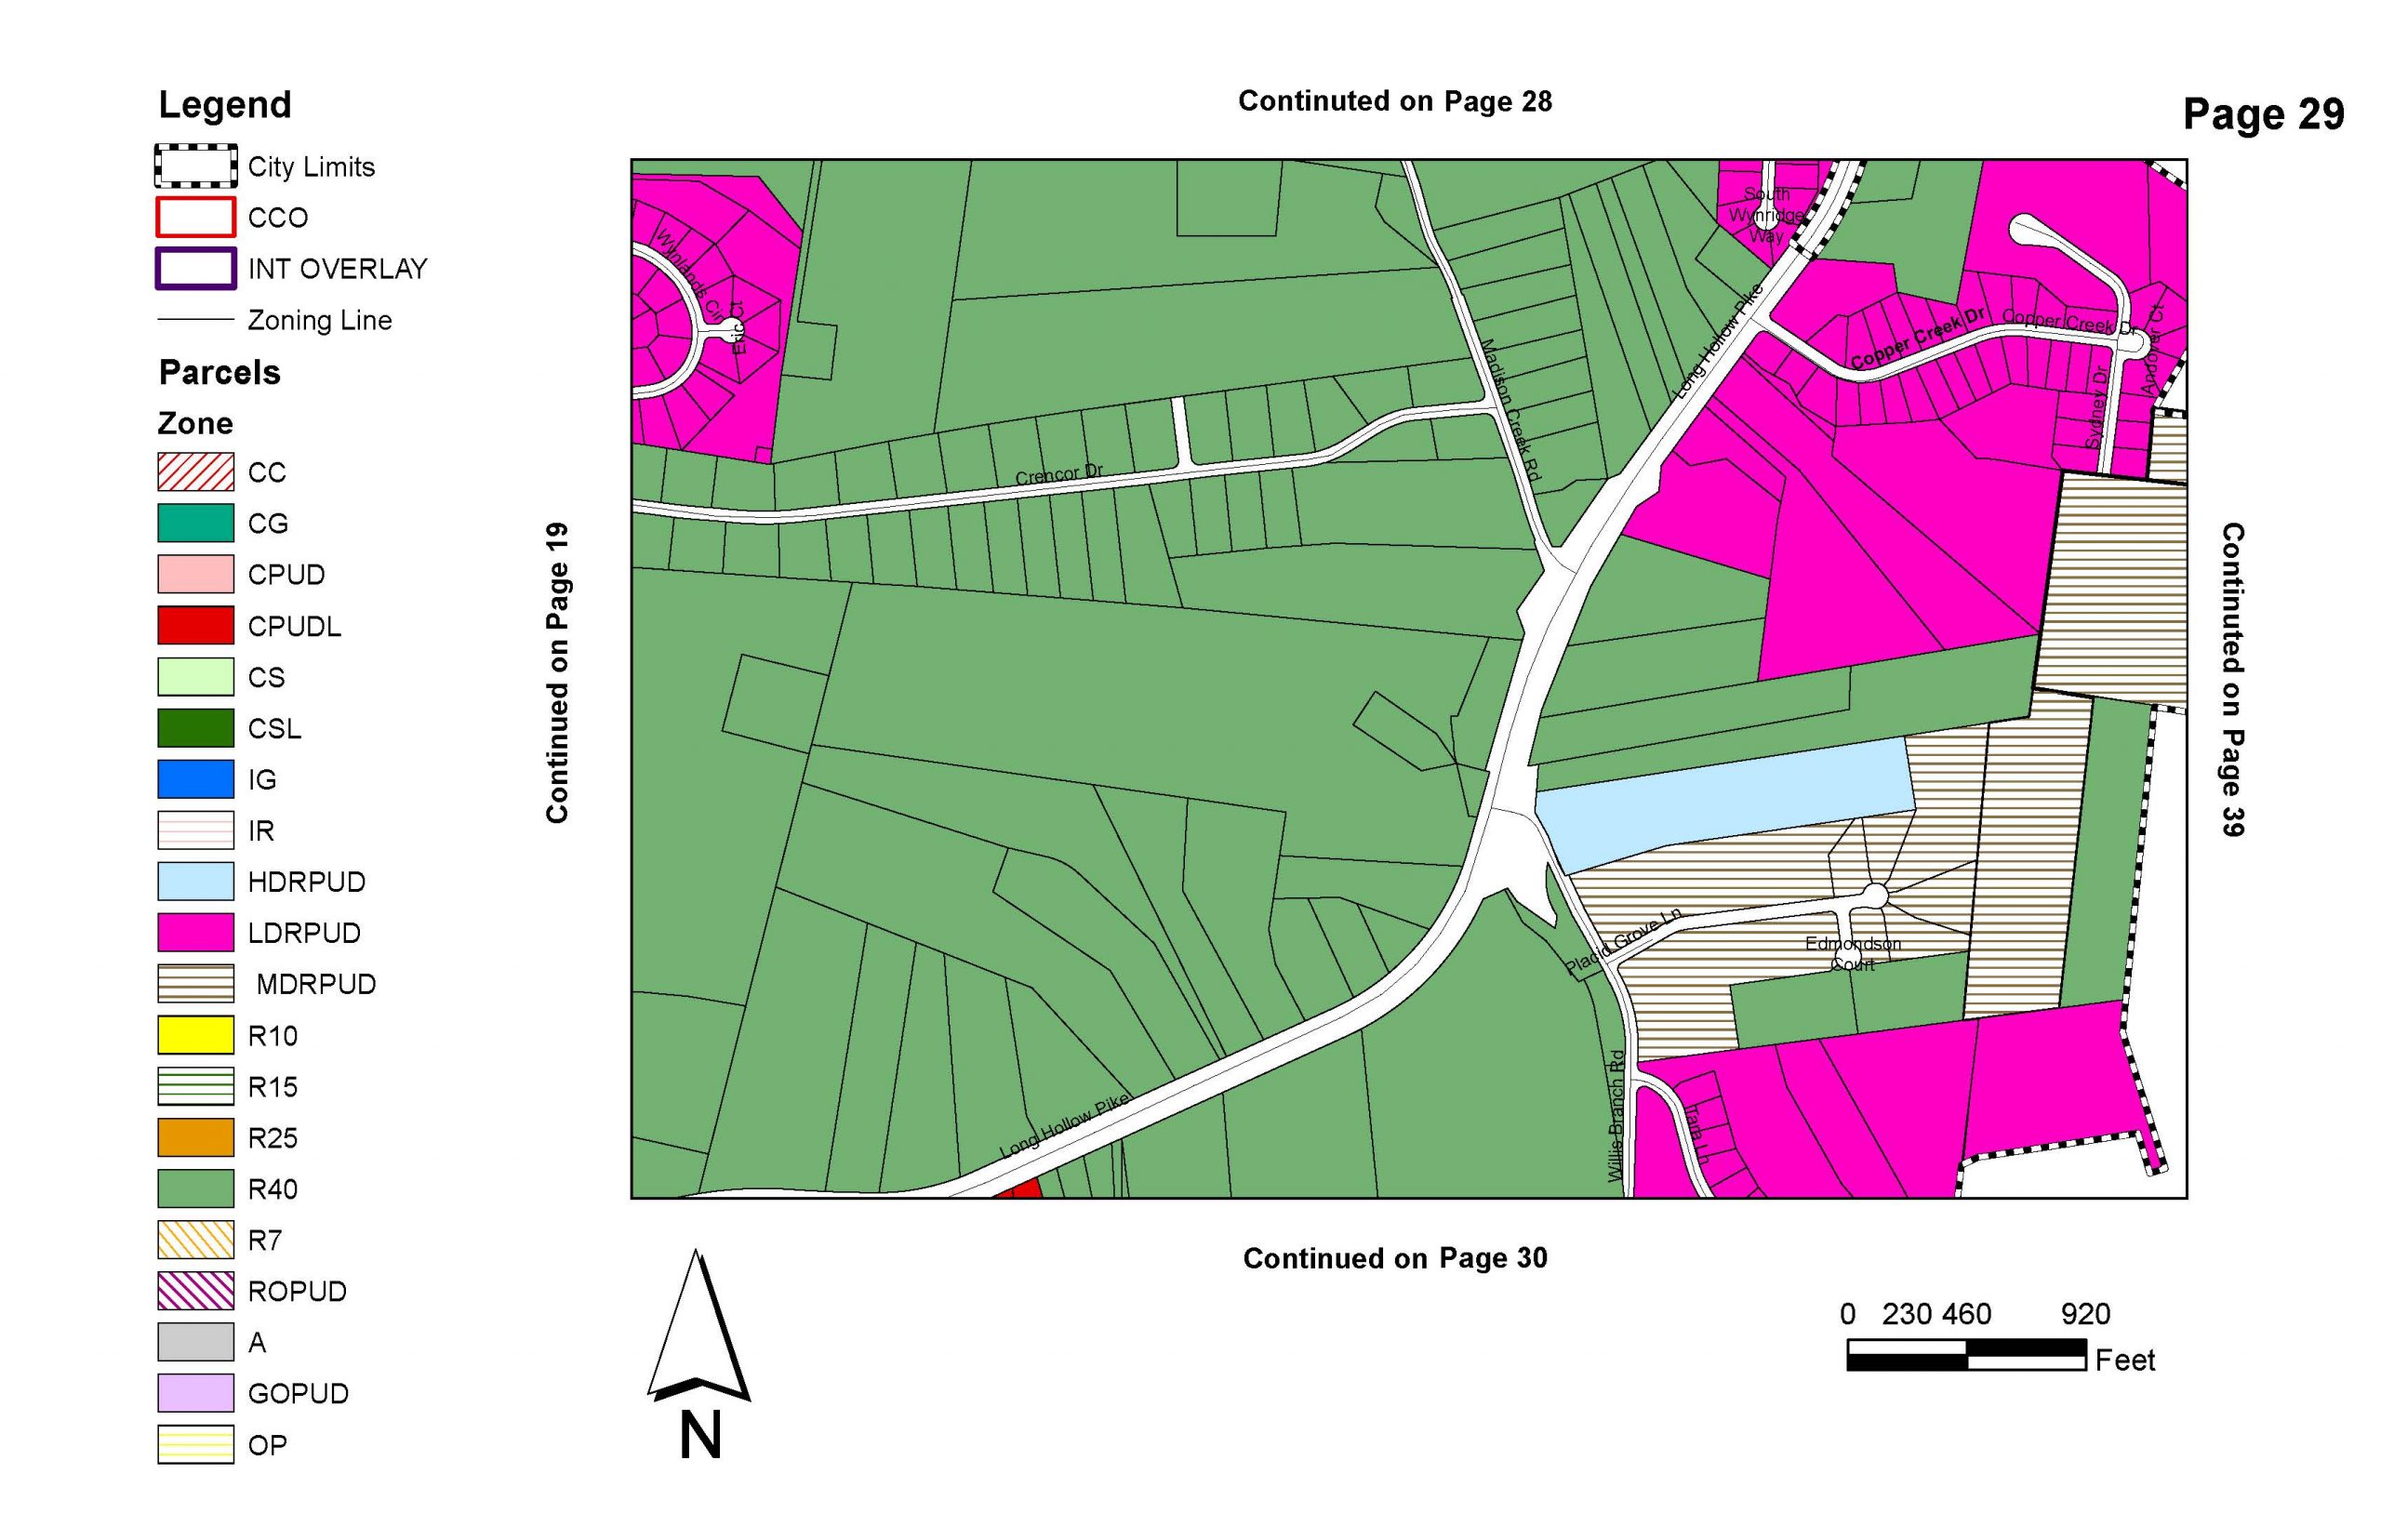
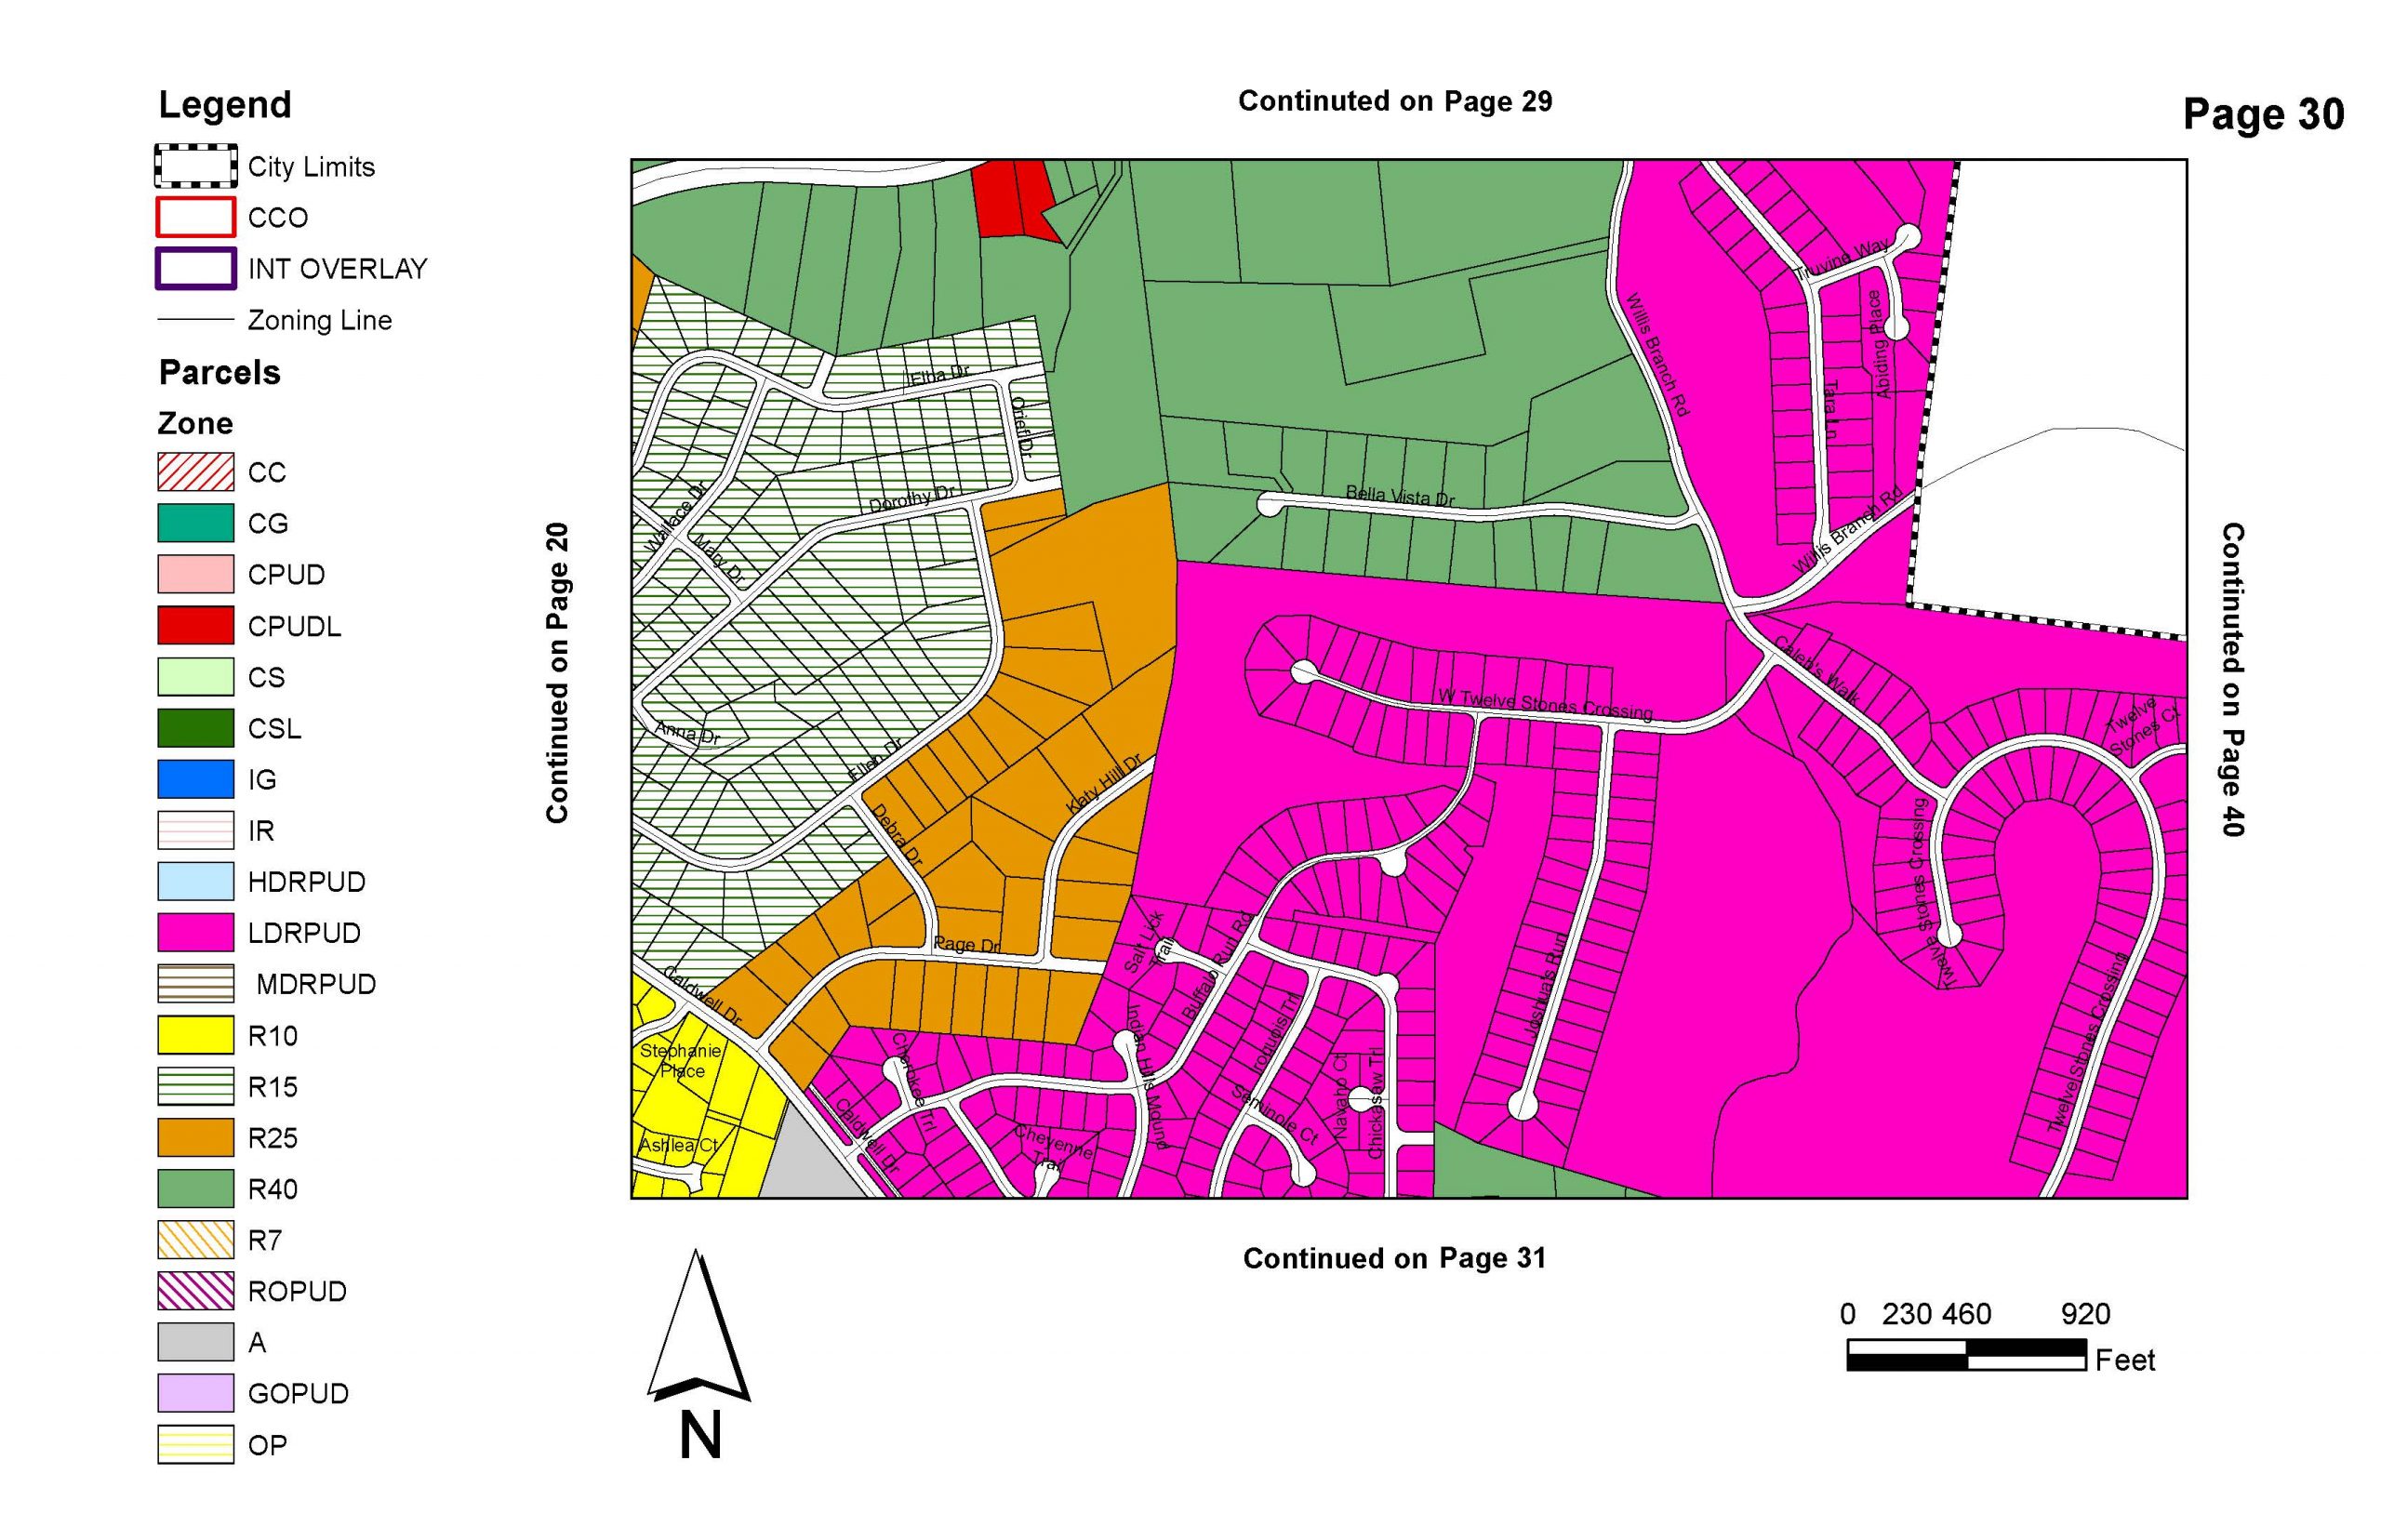
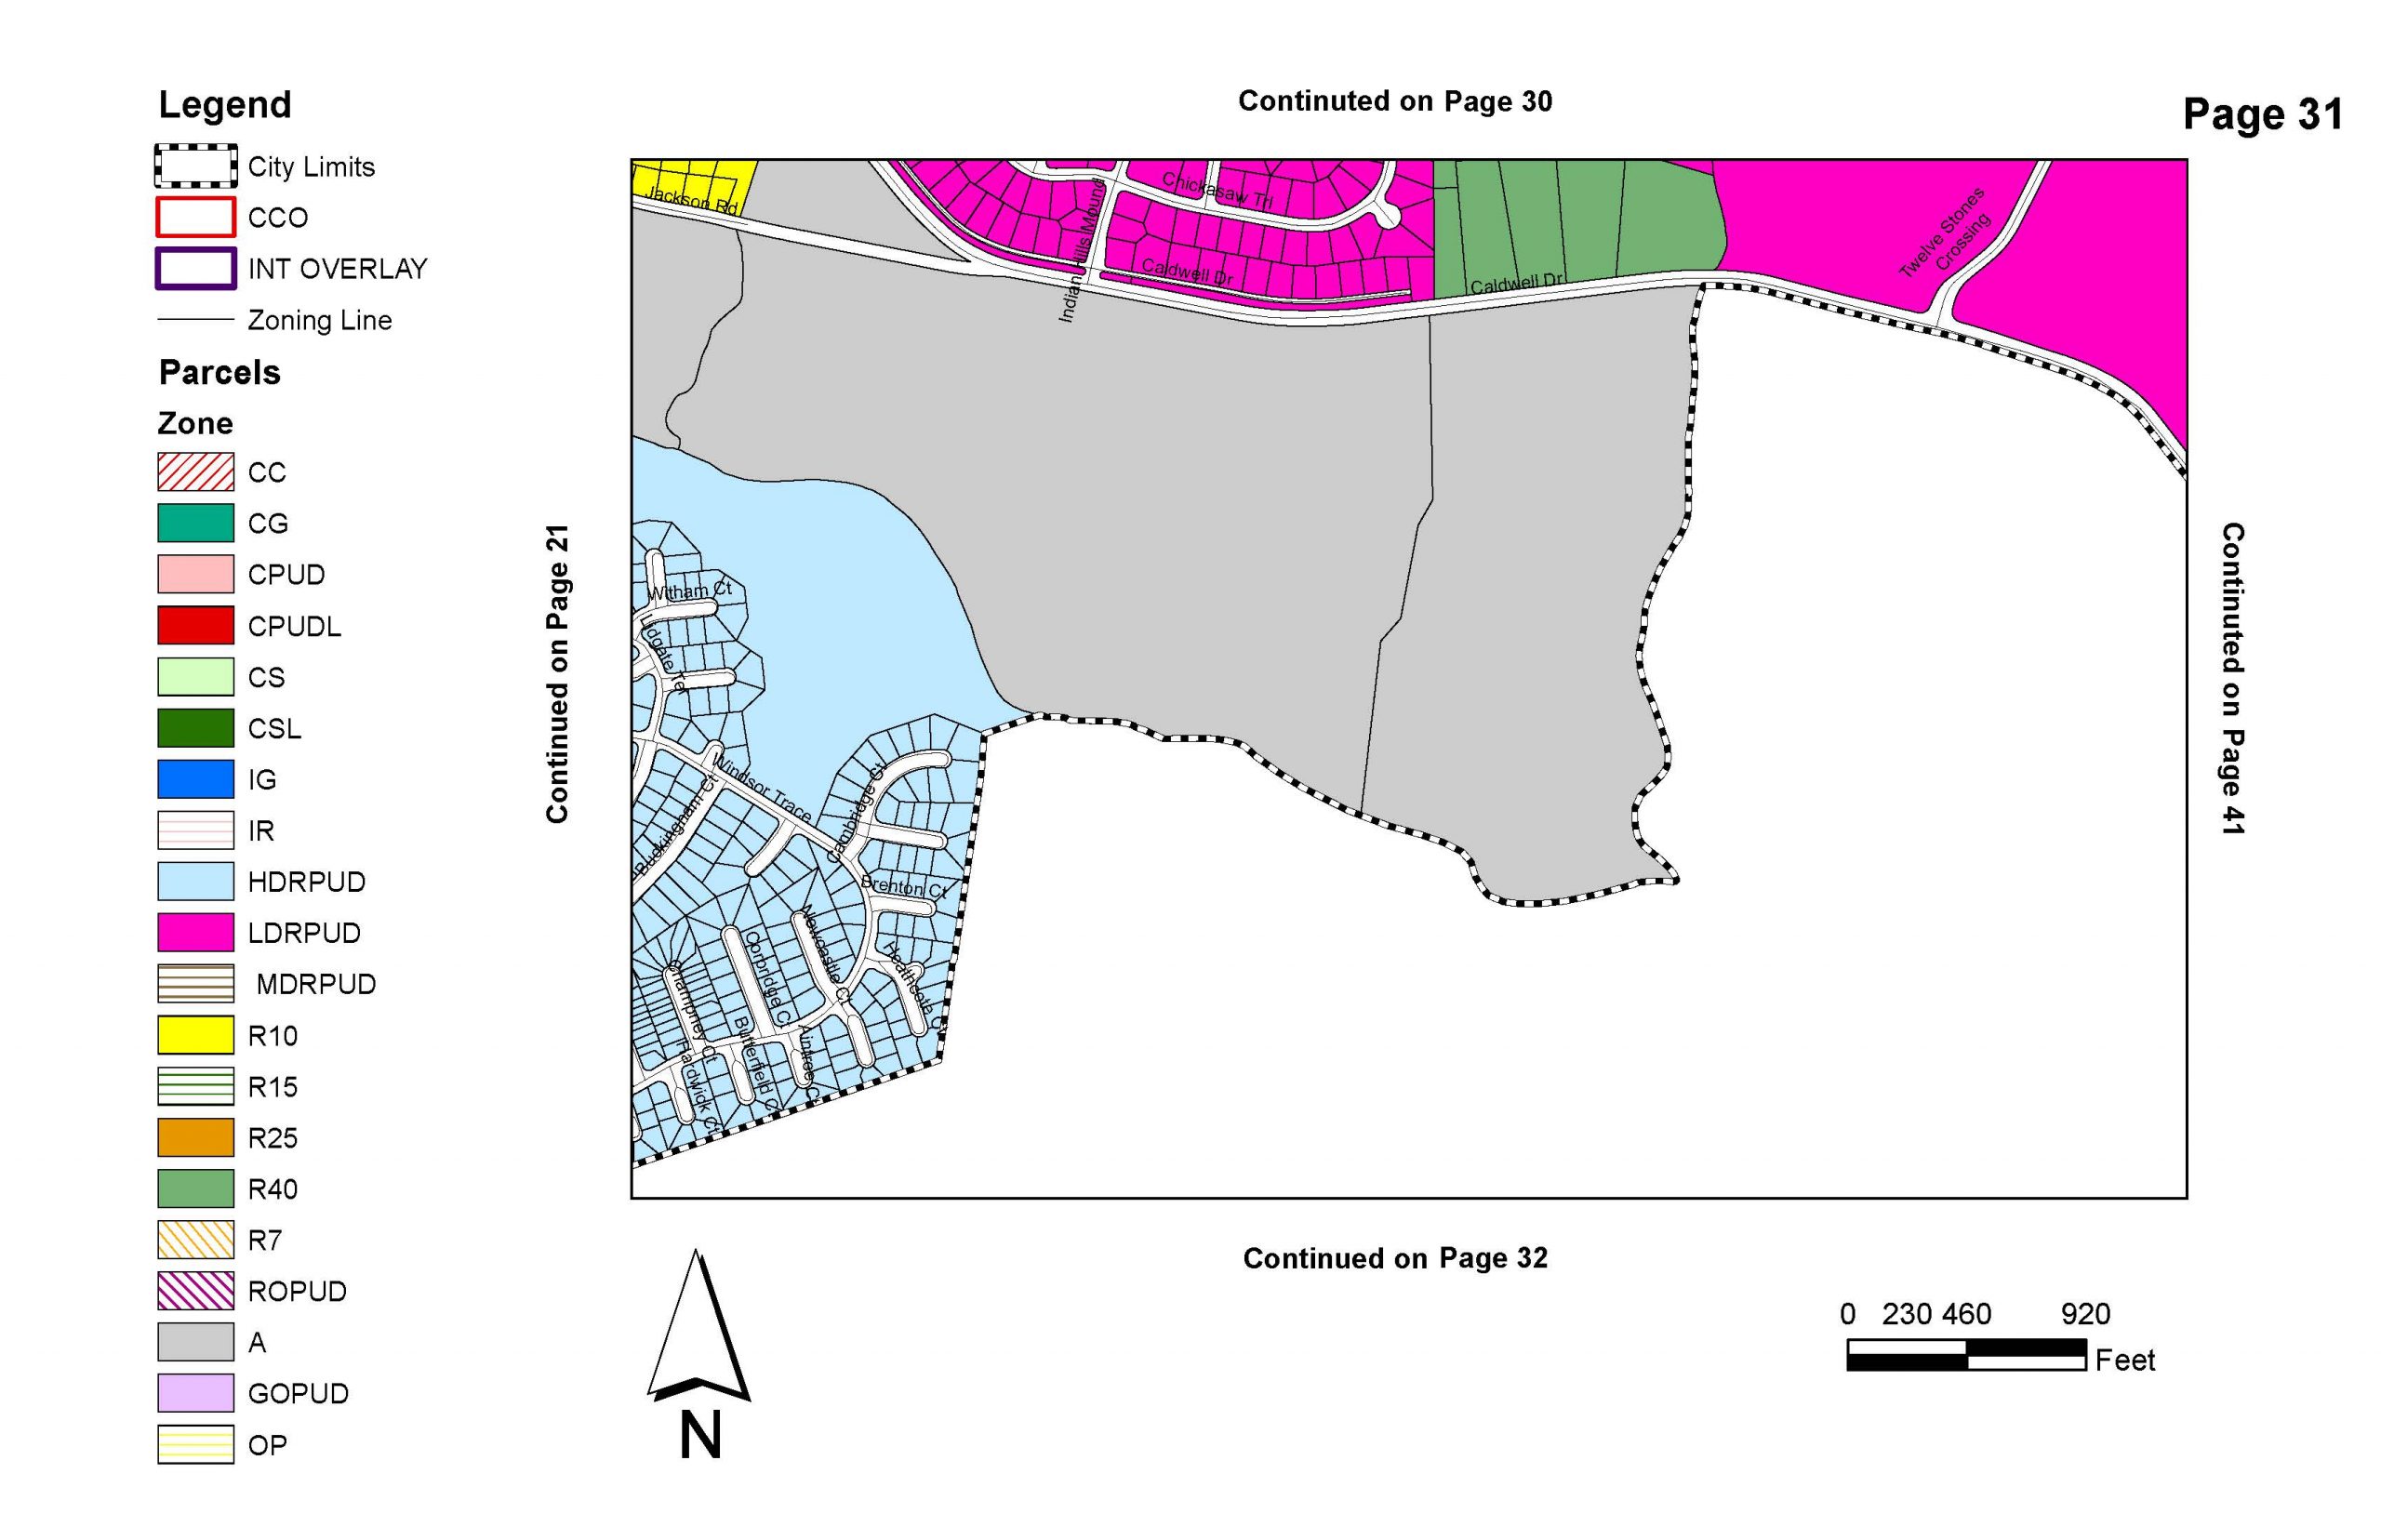
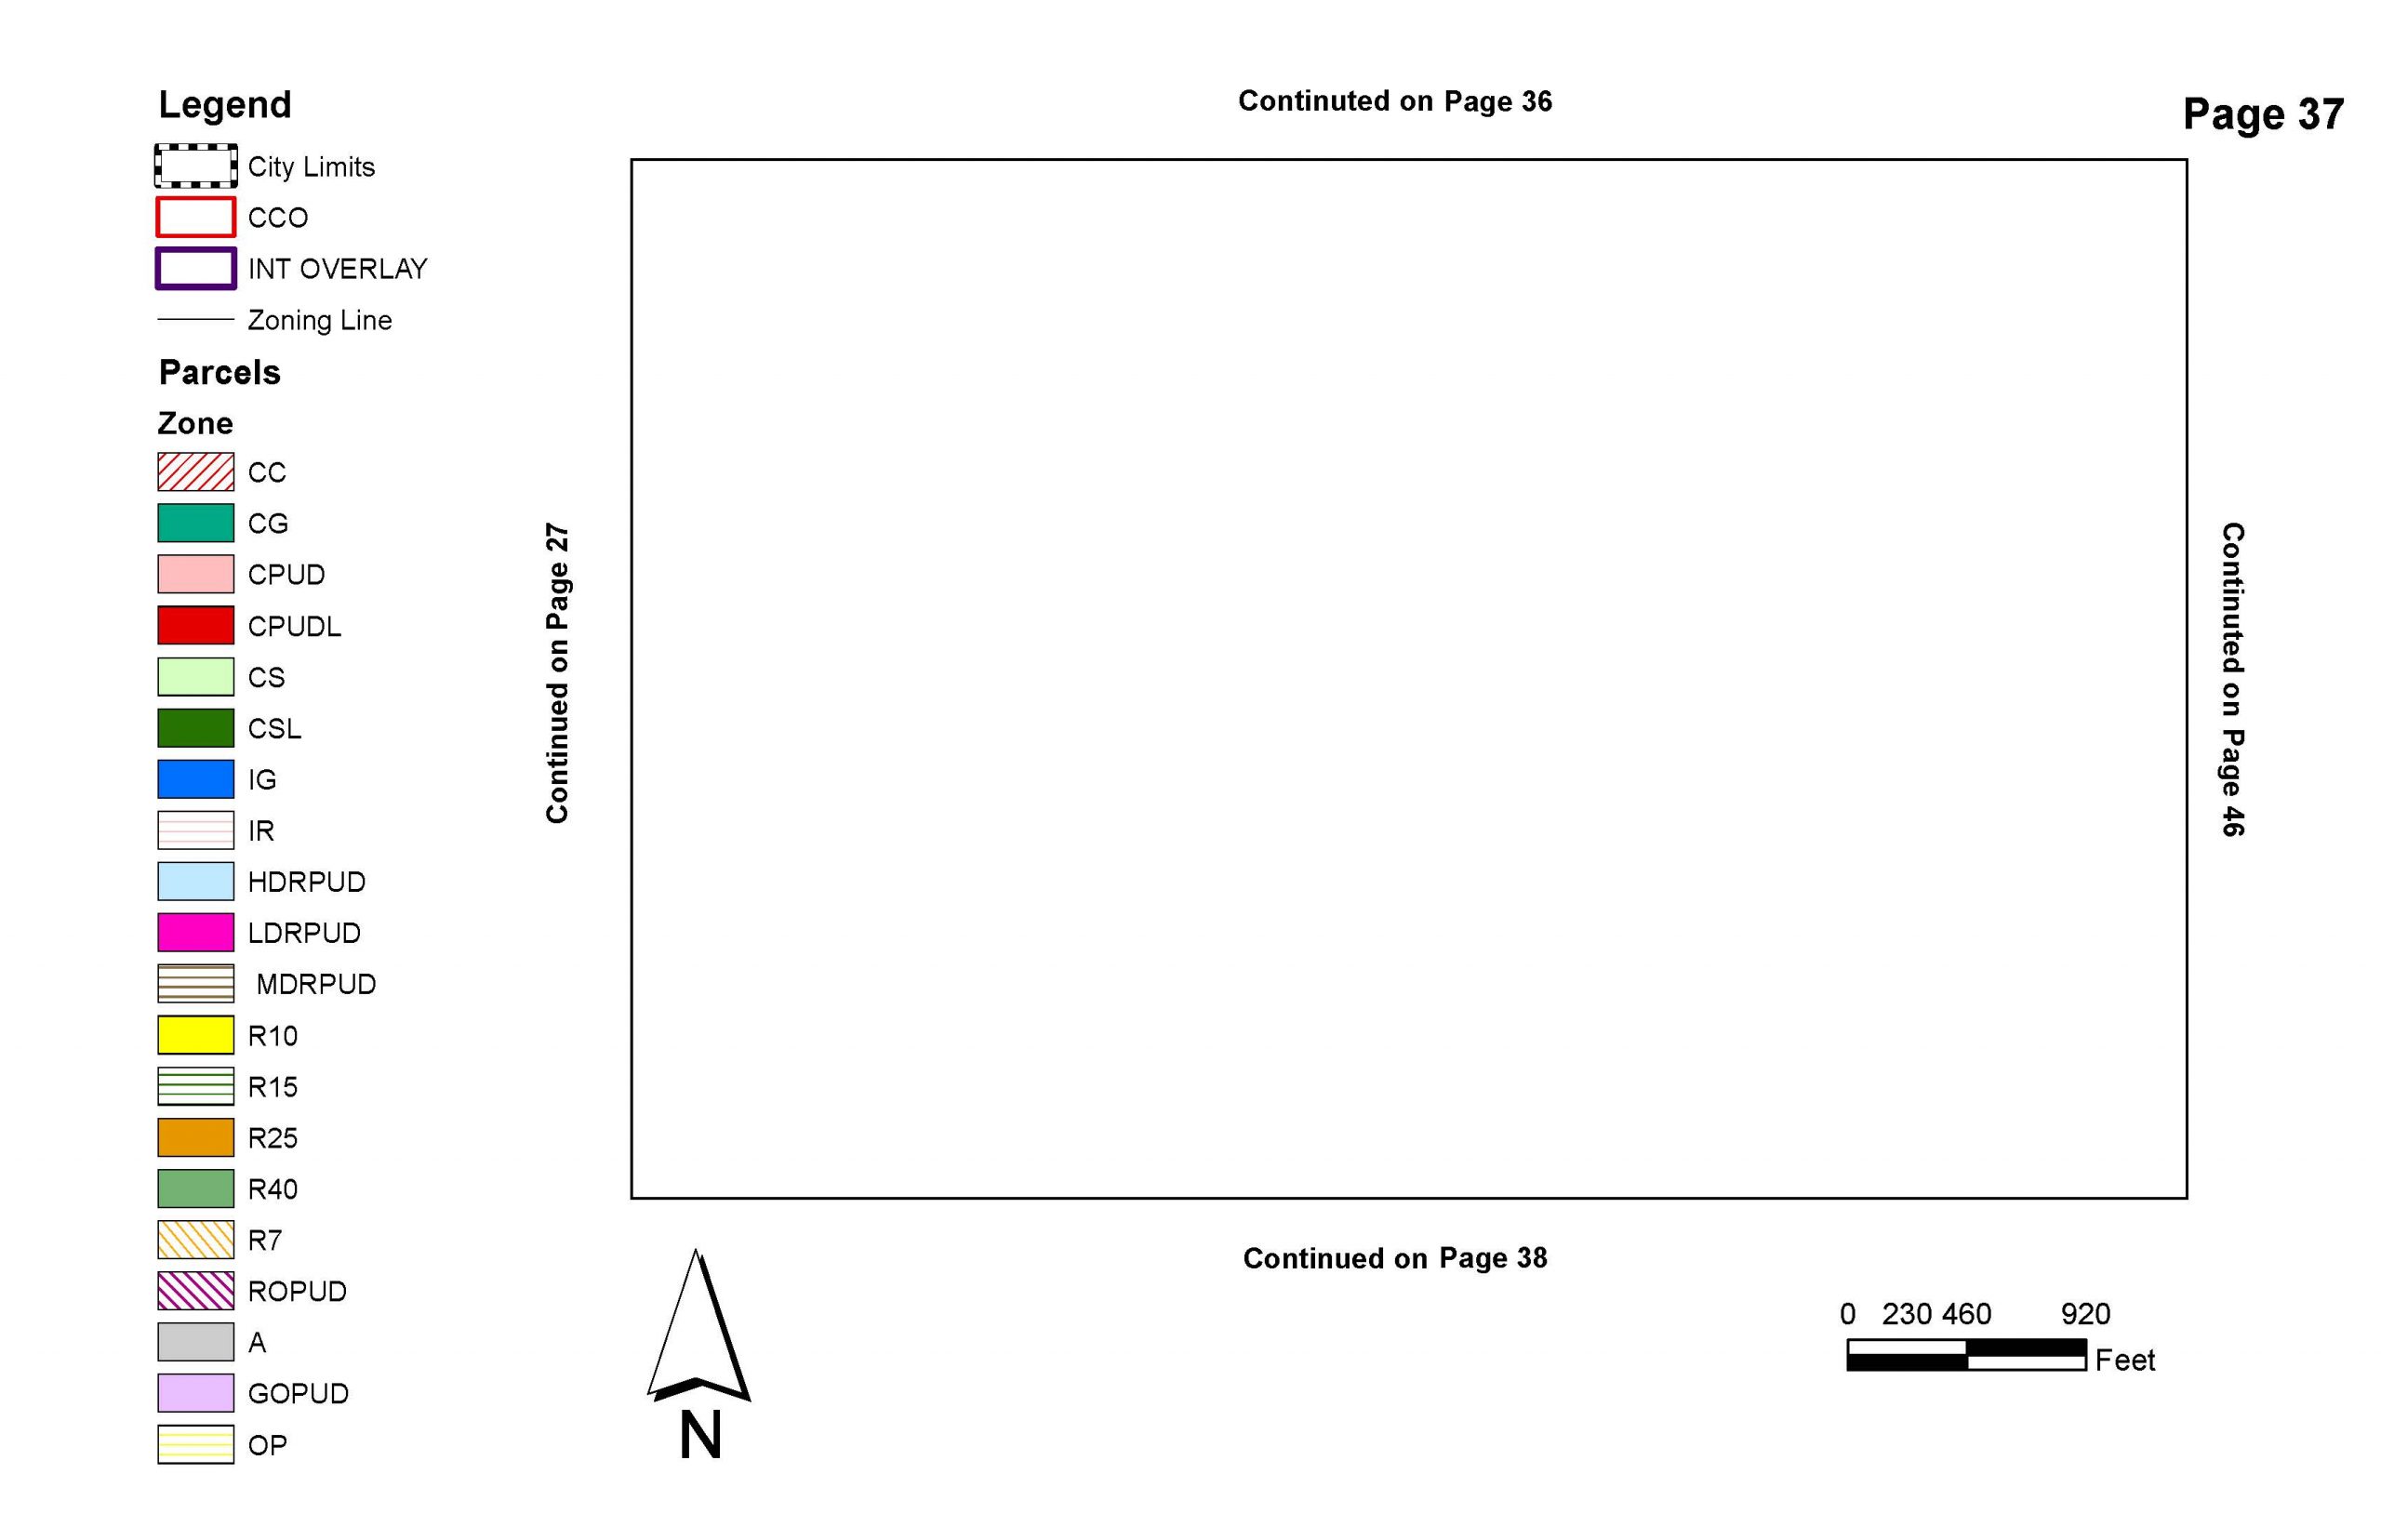
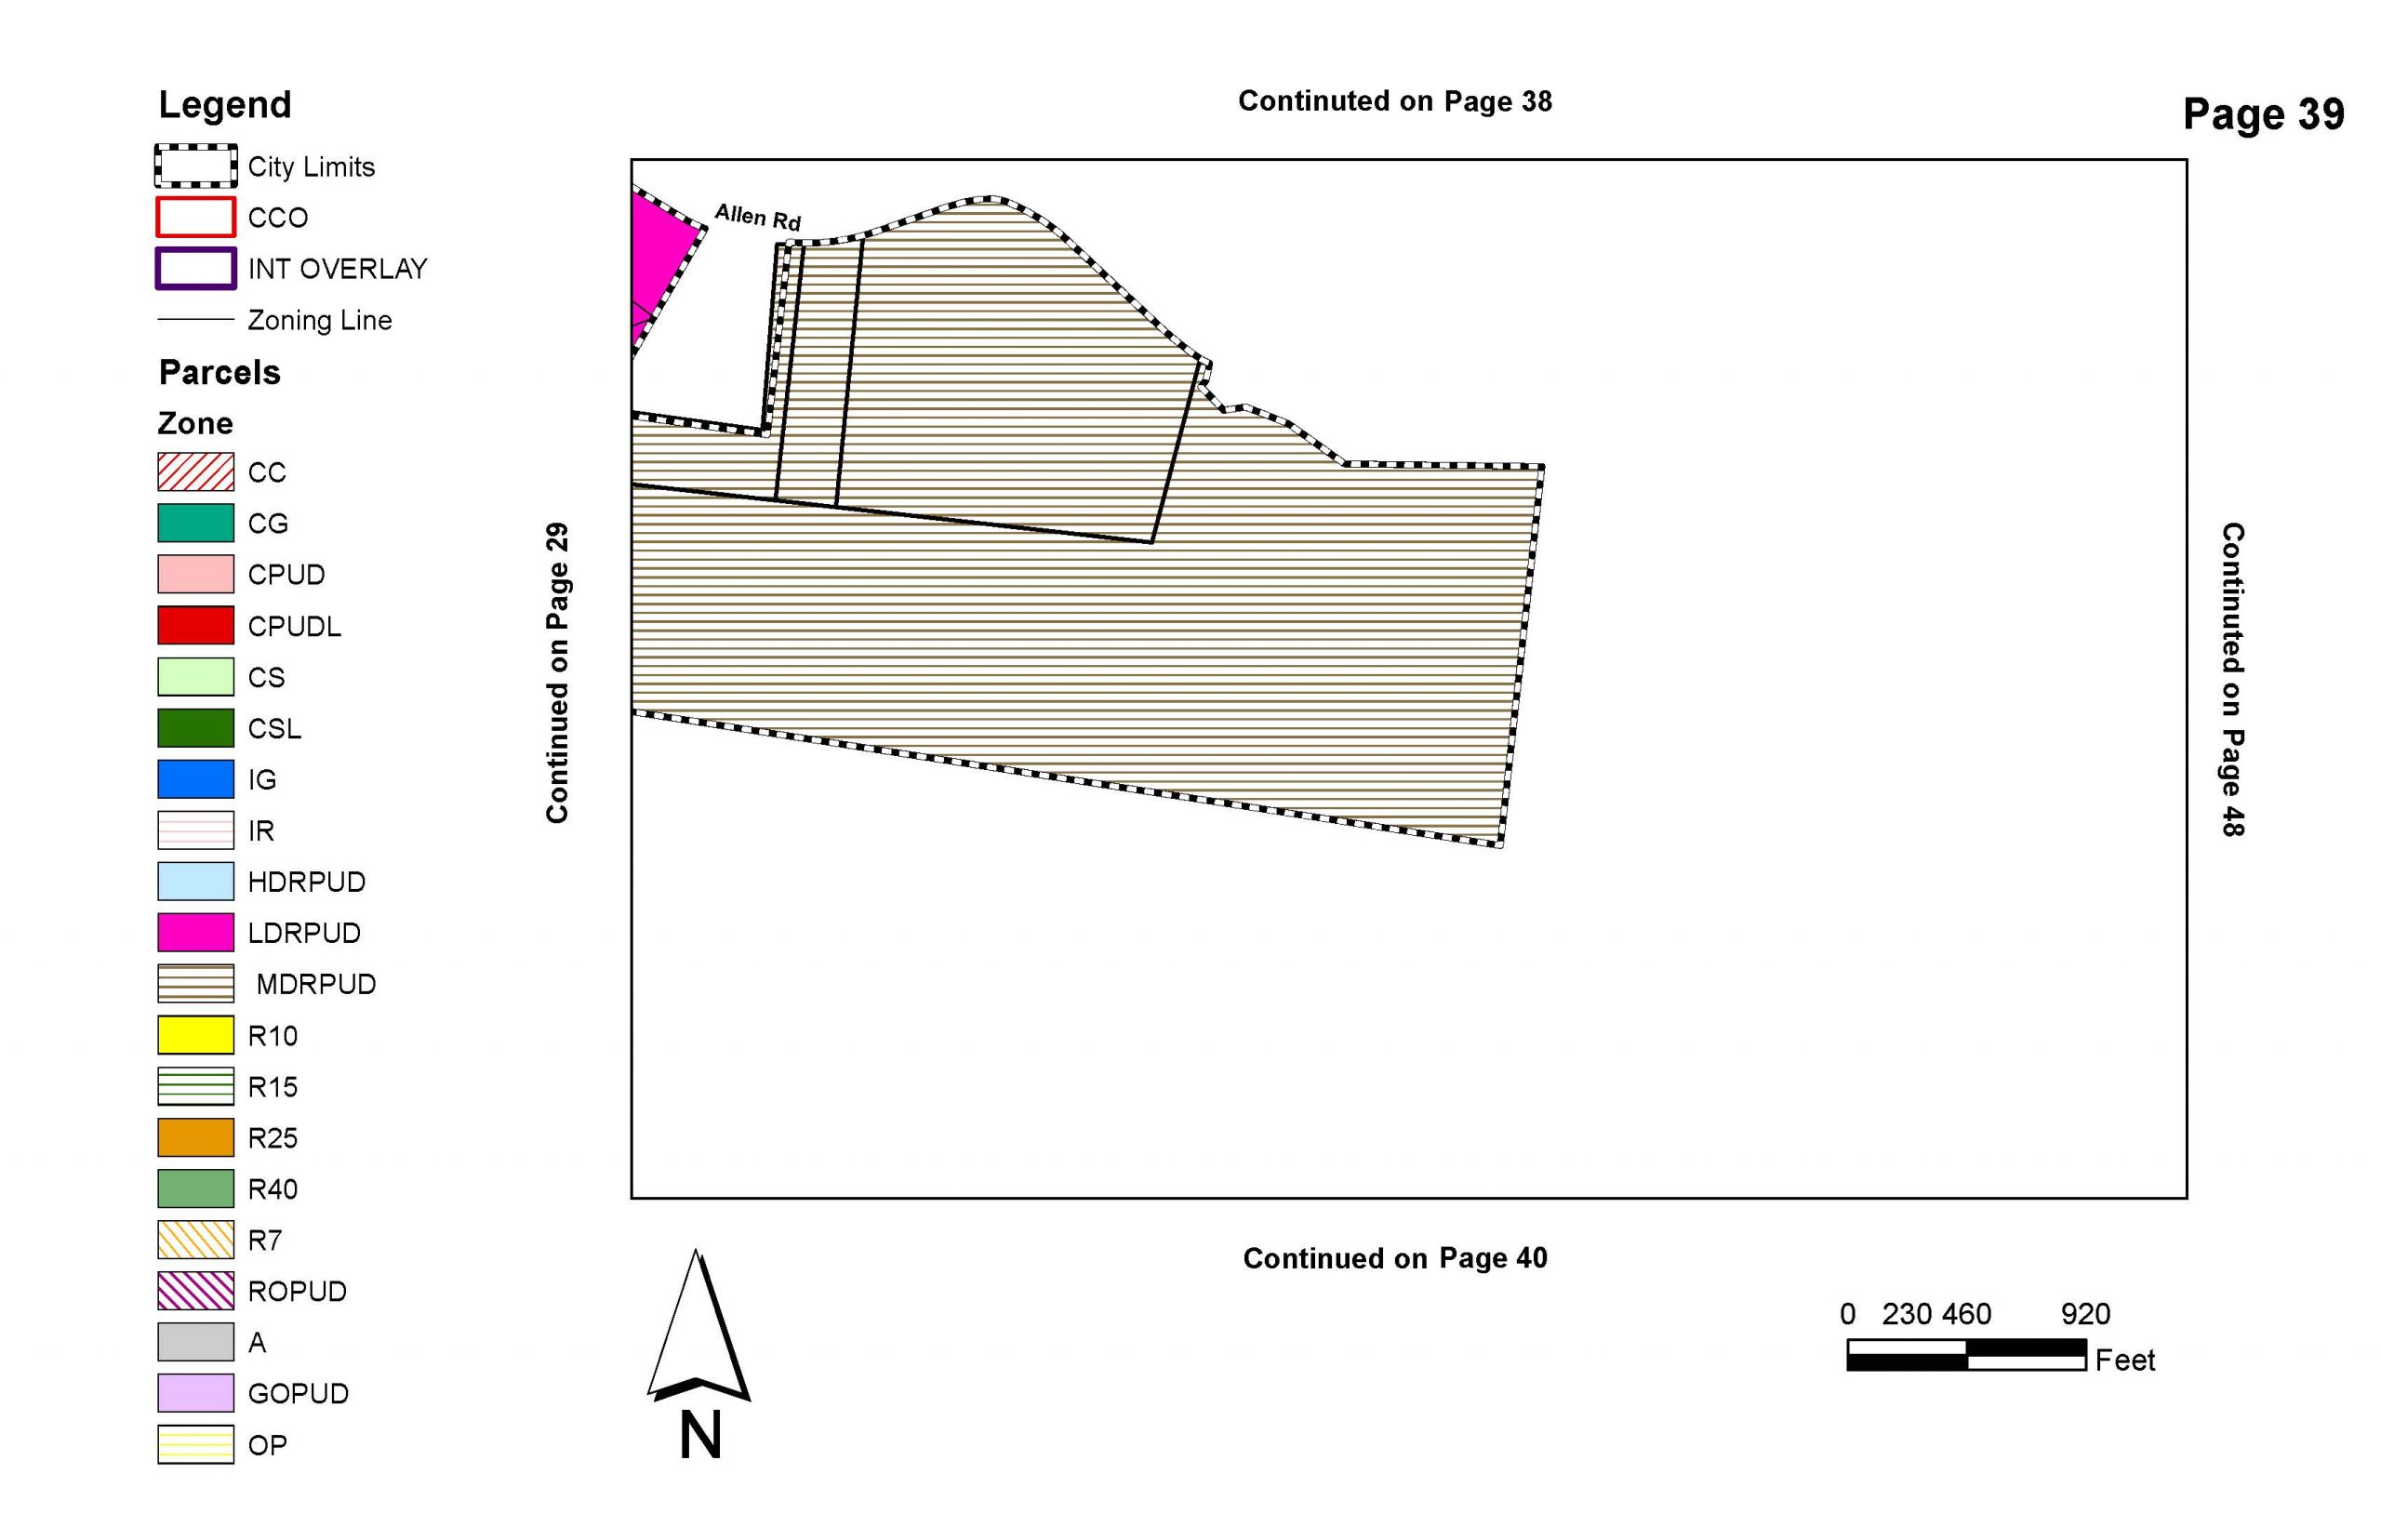
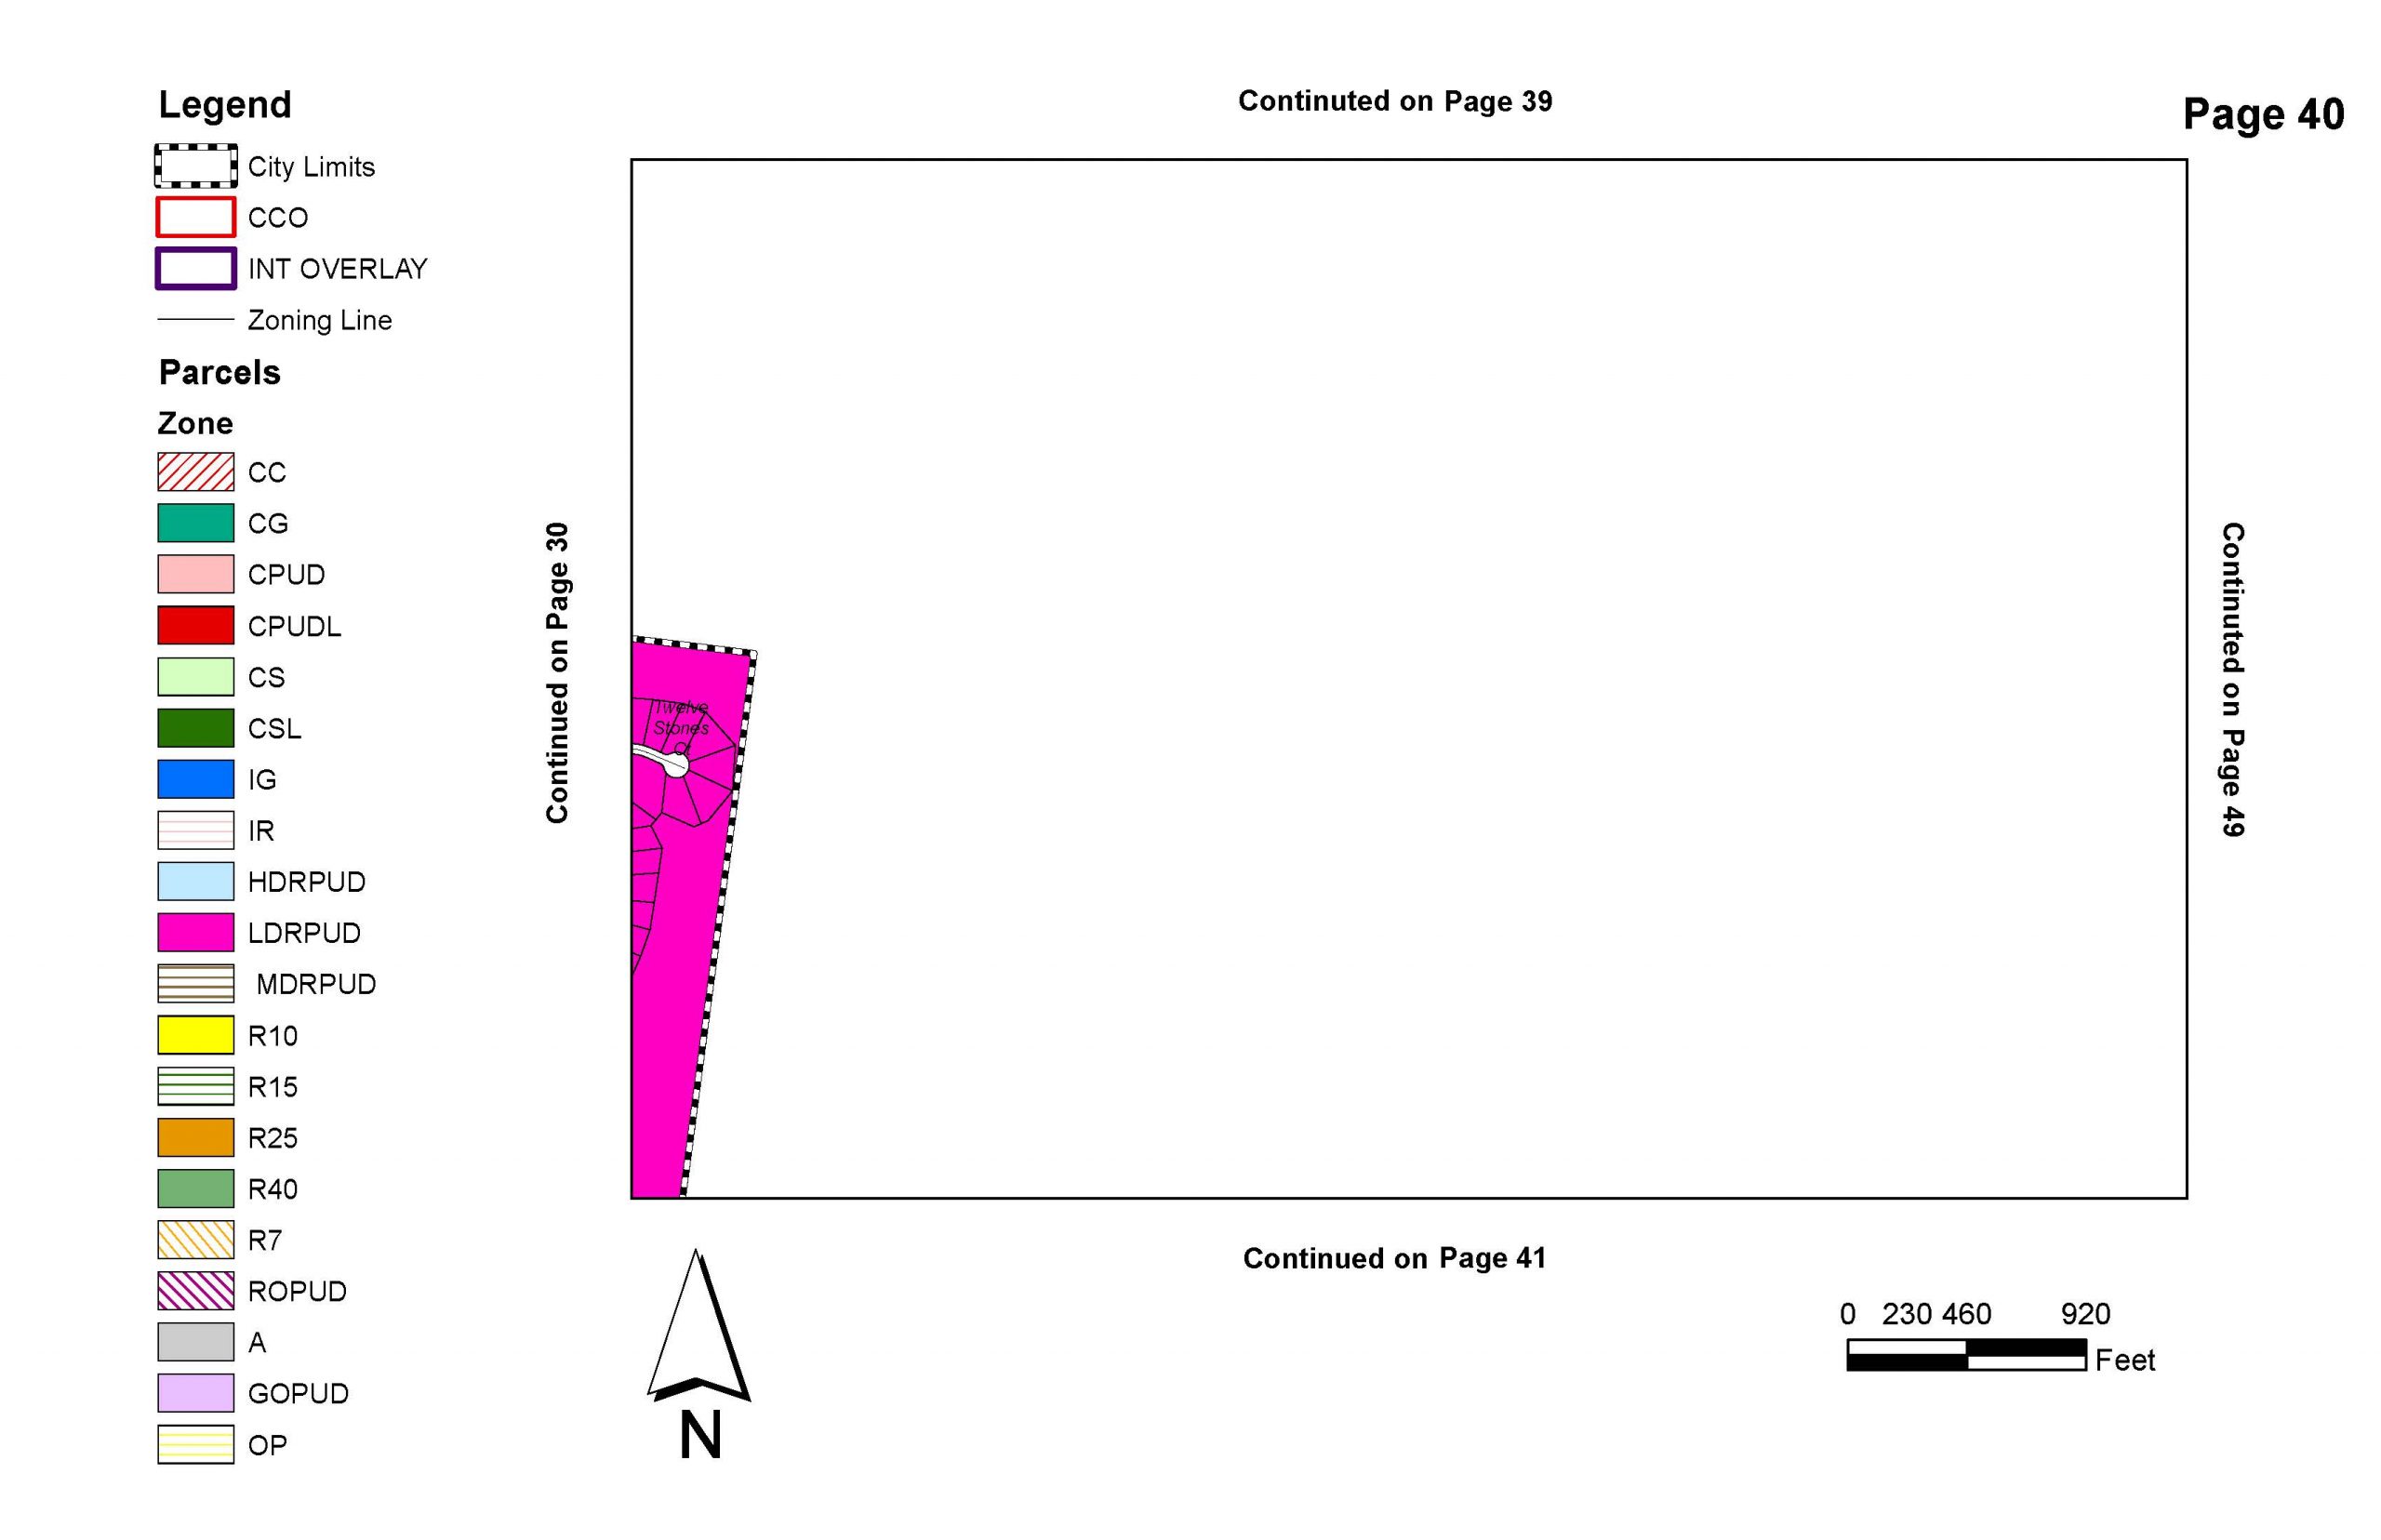
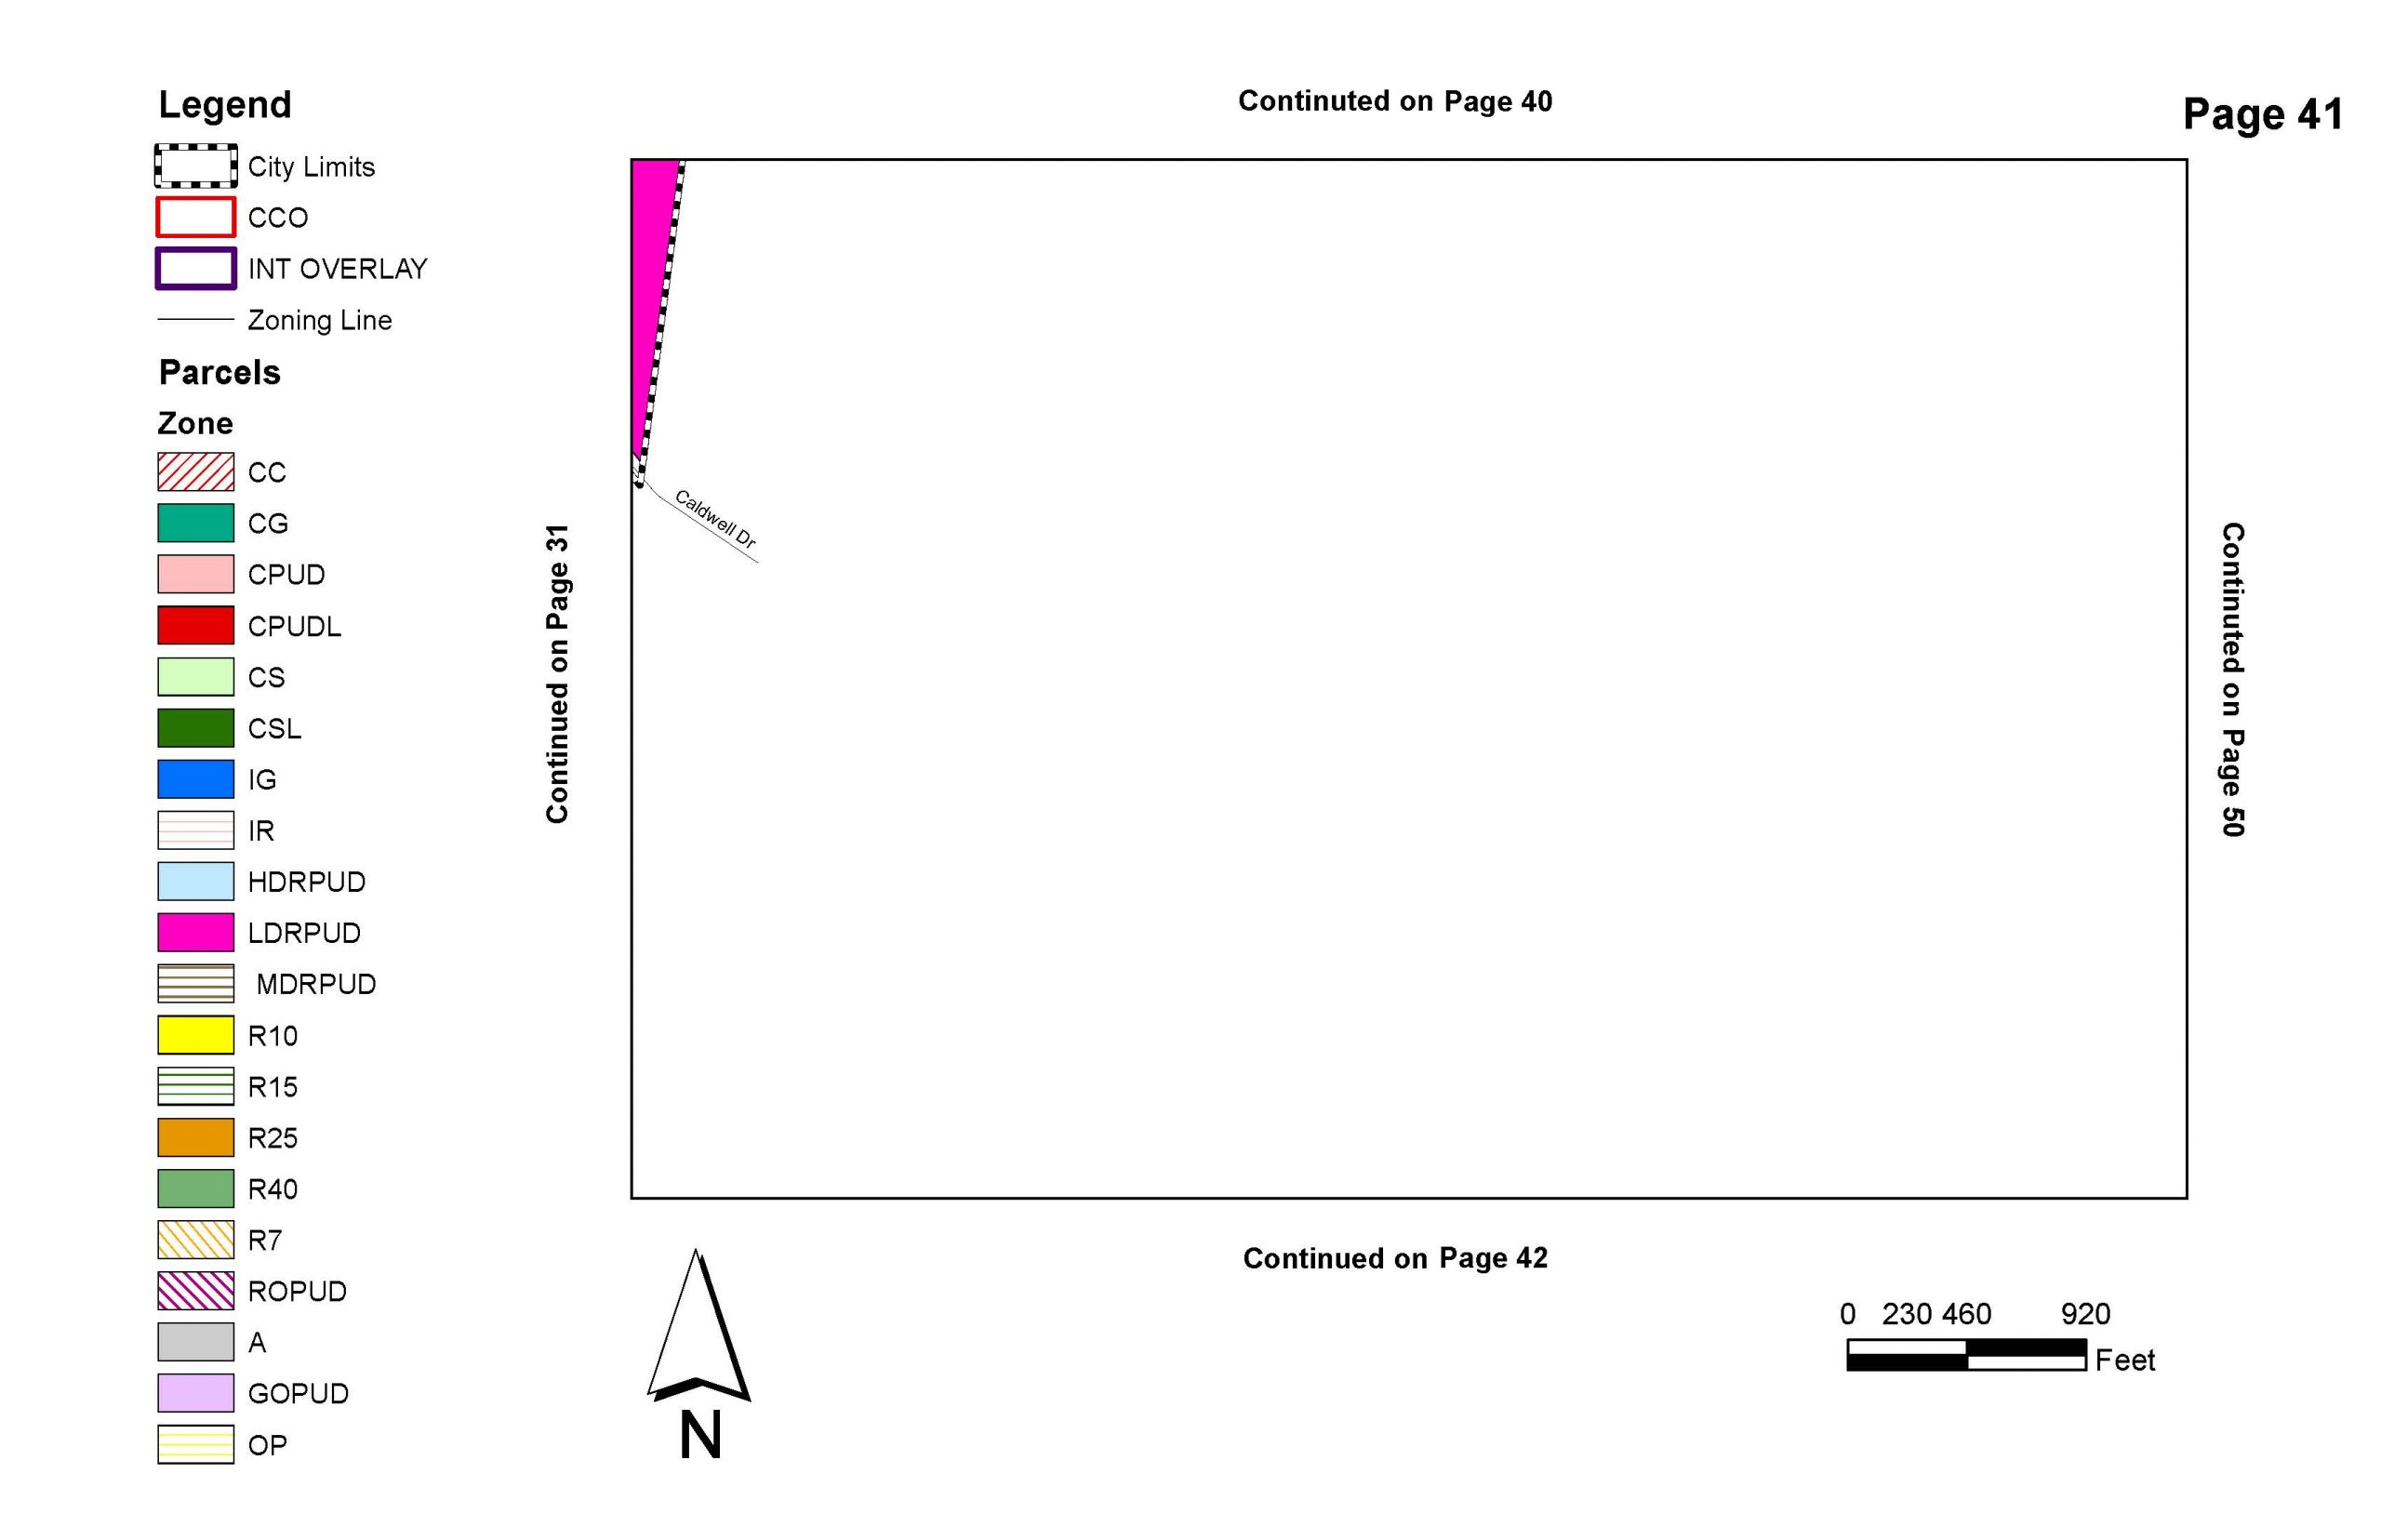
The City of Goodlettsville contacted us looking to create an interactive map that was similar to their PDF zoning maps. Traditionally, they would create the map in ArcMap, export it to PDF, and then have the PDF version on their website for others to access. When you open the PDF it has the overall city and then an index to better navigate through the document. If your property fell within a page such as page 20 you would then flip to page 20 to see what your property was zoned for.


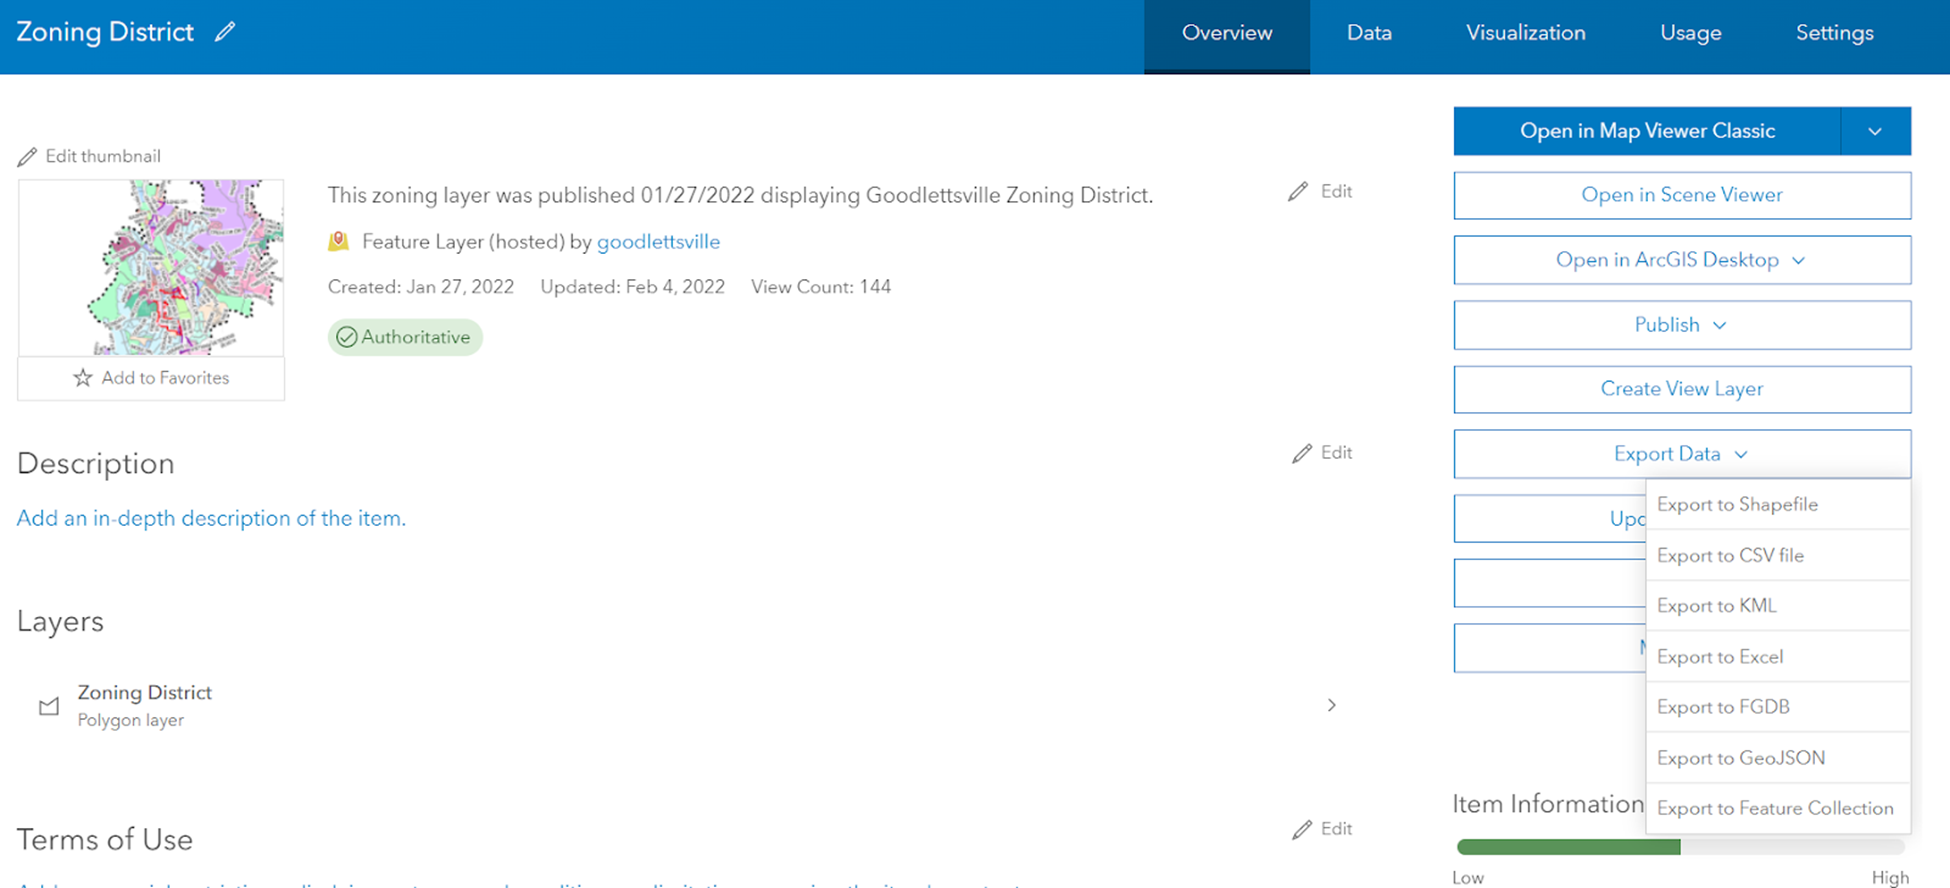
Historically, if people needed the current zoning shapefile they would contact the city for them to send the most concurrent zoning data. Uploading their data to ArcGIS Online allowed others the option to export. Going digital on AGOL cut out those emails back and forth along with having to export the zoning information to the right format with the correct revision date to send to others.
Interactive Map
Once GEO Jobe got the zoning layers and boundaries published to AGOL, the fun part begins! Using Map Viewer we created a custom web map displaying the City of Goodlettsville’s hosted data but also added data coming from outside sources to the web map. The great part about AGOL is, you can search through thousands of layers that are shared publicly and add them to your custom map. For this project, we added Davidson and Sumner County parcel data for others to view the property information once they found their parcel.
On AGOL you can use the Web App Builder (WAB) or Experience Builder to create the application that will be configured to share with the public that’s tied to your map. Depending on how you want the public to interact with your map depends on which application you pick. For this project we chose WAB because of the client’s printing needs. Esri just announced that Experience Builder now has the print widget but at the time of this project, Experience Builder did not have this functionality. The Experience Builder application does have some great qualities. I highly recommend looking into using the application. If you are new to Experience Builder check out our articles Beginners Guide to ArcGIS Experience Builder and Turning Your Maps Around With Map Viewer & Experience Builder.
Zoning Application
Once the WAB application was configured we then shared it publicly. Below is the interactive map that was created for the City of Goodlettsville planning department.
“The format of the updated zoning map provides developers, property owners, and real estate agents quick searchable property zoning information. The updated format map saves city staff time with the numerous requests for property zoning map information. City staff previously received calls from individuals that have taken the time to search for the zoning map on the City’s website but had issues with the current pdf static zoning map format.” ~ Addam McCormick (Director of Planning & Development Services)
With this application, not only can people view the map and data at the click of a button but they can also use the search bar to type in their address and it takes them straight to that location. We added several different widgets to help users be able to add data, change the basemap, turn on and off layers, share, bookmark, print, etc. Esri offers over 50 different widgets in WAB that allow you to customize your app the way you want users to interact with it. So it all is up to you on what widgets you pick based on how you want the user to interact with your application.

GEO Jobe Services
Have you wanted to transition your paper maps and go digital? Then we’re here to help! Our team has created multiple customized applications for client’s to make their day to day tasks easier. Reach out today for a free consultation to discuss the new apps we can create for you at connect@geo-jobe.com or call 1-844-GEO-JOBE.