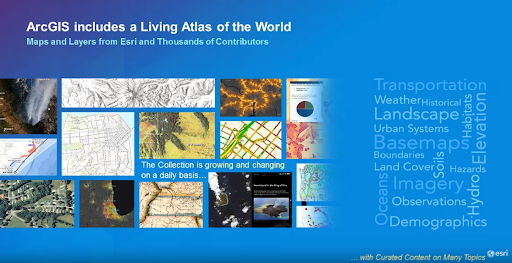
The living Atlas of the World is a constantly growing collection of ready-to-use maps, apps, and data, all curated by Esri and available for use by the community. The Living Atlas of the World is made available by Esri, with content provided by Esri and thousands of partners, organizations, and users from around the World. Users are encouraged to explore this data and combine it with their own data and content to create maps and applications and perform analysis. In the words of Esri’s Bern Szukalski @bernszukalski, “the Living Atlas is a GIS for the planet”.
To say that the content available via the Living Atlas is vast would likely be an understatement. Data themes vary widely and include such popular topics as weather, traffic, census, transportation, economic, earthquakes, transportation, environmental, economic and much more! Not only are data layers available, but users can also access base maps (raster and vector), satellite imagery and 3D scenes.
The Atlas can be accessed from any part of the Esri ArcGIS platform, for example, through ArcGIS Online, ArcGIS Pro, Story Maps, etc… Additionally, for ArcGIS Enterprise portal users with access to the Internet, your portal administrator can configure it to access ArcGIS Living Atlas of the World content from ArcGIS Online. ArcGIS admins are reminded to adopt our Admin Tools for ArcGIS Online (free, Pro, or Portal) in order to more efficiently manage your organization’s users and data assets.
The Atlas Continues to Grow
Much of the data found in the Living Atlas (over 10,000 content items) is regularly updated and live data feeds are available providing continuously up to date information (weather data, streamflow, hurricanes, earthquakes). Note, these emergency data feeds are available for free (no subscription) and are available via a hosted AGOL environment. Best of all perhaps, the Atlas continues to grow, with data and maps being added daily.
Esri’s Bern Szukalski has likely provided the best summary description of the Living Atlas in the following video. In less than 5 minutes Bern shares a fine look at the Atlas while providing a summary of new data resources that were included back in 2018. Following that I delve briefly into the who, what, where, when, why, and how of the Atlas, along with a list of my 10 favorite things about the Atlas and some of my favorite suggested data picks.
New, Exciting Data in the Living Atlas
Keeping up with the thousands of data layers, web services, and other data products included in the Atlas is no easy task! With new additions almost daily, there’s something of interest for everyone. Recently, several noteworthy additions have been published.
At the time of writing this article, a new Map of Biodiversity Importance (MoBI) was just published by NatureServe and released into the Atlas for all. This map uses outputs from habitat suitability models for 2,216 of the most imperiled species in the lower 48 United States. The MoBI layers are designed to be used with other factors that you might want to consider (think mashup) when prioritizing land protection such as real estate costs, distance from roads, or habitat connectivity.
Places in Vector Basemaps (Beta) is a HUGE, exciting addition to the Atlas! In a recent blog post by Deane Kensok of the Living Atlas team, he describes the first set of places to be included in the Vector basemaps. The “Places” layer displays the locations of restaurants, stores, businesses, and other POIs – several million in this first iteration! The places are symbolized by category, with some 100+ categories initially released. Users can find these POIs by using the Streets and Imagery Hybrid base maps from the Living Atlas. Learn more in this blog post.
Data from Federal Agencies – For a fantastic look at some of the coolest additions to the Living Atlas in 2019 be sure to consult this blog post about items contributed by Federal agencies. In particular, take note of the CDC 500 Cities Project, a data-rich effort that shares 27 measures of chronic disease, by tract level for 500 cities. These data and more are available for you to use, mashup, and build amazing maps and apps.
The 5 Ws of the Living Atlas
Who…The Living Atlas is a vast resource of geographic data that has been contributed by the Esri community and user community and curated by Esri. According to Esri, the Living Atlas is comprised of “valuable maps, data layers, tools, services, and apps for geographic analysis”. These data, when combined (mashed up) with the users’ own data, enable them to create maps and apps that are then made available to internal user groups or the public at large. So, who are the data providers? Well, in addition to yourself and the entire Esri partner and user ecosystem, some noteworthy providers include The David Rumsey Collection, CDC, NOAA, National Geographic, US Census Bureau, and many more. To participate and contribute to the Living Atlas, see more.
What… Maps, layers and tools published by Esri, Esri business partners, and the user community, categorized, and curated by a team of professionals. These are valuable data that are useful to users all over the World for use in map, web maps, and apps. Recall, in the past map creators would sift through FTP sites searching for and downloading data for use in their maps. Those days are done! At the heart of the Atlas you’ll find a wide selection of basemaps for use in your maps and apps. Vector and raster basemaps are available, as are vector tile basemaps. For your maps and analysis discover thousands of layers of data items.
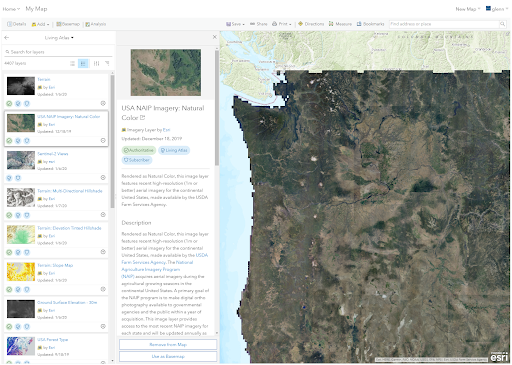
Where… Working with or accessing the Living Atlas is relatively simple. Within ArcGIS (Pro and ArcGIS Online), you’ll find that the Atlas and the data are always ready at your fingertips. At the most basic level, using an example of creating a simple map with ArcGIS Online, including data from the Living Atlas is just a couple of clicks away. Within “Your Map” select the Add menu option, then pick “Browse Living Atlas Layers”. From here you’ll be presented with a search dialog enabling rapid search, sort, and filtering of data from 4405 data layers. Find your data or a base map (yes, including imagery or vector tiles), click on it to reveal a description and meta-data, then “Add to your Map” – It really is that simple. For the example below, the NAIP color imagery basemap was added to the map. The result is an impressive base map as a starting point for further mapping and analysis. Furthermore, this basemap can be used throughout my organization for consistency.
When… The Living Atlas was announced as ready to use content of the World at the ESRIUC in 2016. Today, the Atlas lives on and continues to grow, providing thousands of data layers, basemaps, data feeds and apps to the user community.
Why… The most compelling reason for using the Living Atlas is no doubt that this is a gateway to authoritative data. Building custom maps, web maps, and apps has never been easier and having access to trusted, curated data can provide you and your users with confidence in your work.
TIP.
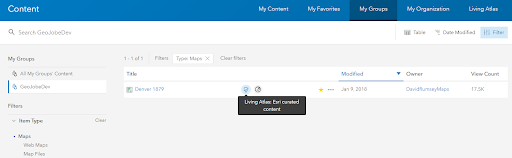
A handy tip for organizing Living Atlas data within your organization. Create a central group(s) where all your users can access base maps and living Atlas content as determined by your data administrator. Notice in the example below, a David Rumsey basemap of Colorado has been shared. This is a handy way for you to curate data for use within your org
Noteworthy Living Atlas Maps and data
Data are available in the Living Atlas in a number of ways including basemaps, imagery, data layers in a number of themes including boundaries, population data (census, economic, health, education), infrastructure (transport, utilities), and environmental data products. The following are several of my favorite and coolest things found in the Living Atlas:
Wildlife hazard potential – This map service displays those areas within the continental United States that have different levels of fire potential, categorized by five WHP classes of (very low – very high) and two non-WHP classes (non-burnable and water).
World Traffic services – This map service presents historical and near real-time traffic information for different regions in the world. The data is updated every 5 minutes.
Ocean basemap – This map is designed to be used as a basemap by marine GIS professionals and as a reference map by anyone interested in ocean data.

World hillshade – This layer portrays elevation as an artistic hillshade. The map is designed to be used as a backdrop for topographic, soil, hydro, landcover or other outdoor recreational maps.
Weather and wind station data – Created from hourly METAR station data provided from NOAA, this layer contains approximately 11 weather variables for each location.
Corona Virus 2019 nCoV Cases – One of the newest data products added to the Atlas, this feature layer contains the most up-to-date 2019-nCoV cases and latest trend plot. It covers China (in province level), the US, Canada, Australia (in city level), and the rest of the world (in country level).
Go ahead and browse the Atlas for more data here!
10 Favorite Things about the Living Atlas:
- Open and Transparent
- Amazing, beautiful, professional base maps for all
- A constant flow of new data made available
- Professionally curated
- Easy integration in all your maps, apps, and web maps
- Create and build your own base maps to use/share throughout your org.
- Live data feeds and real-time Earth observations are constantly updated
- Vector tile layers (for fast rendering and easy customization)
- OpenStreetMap – yes, OSM data is available!
- Anyone can contribute!
Participate & Contribute
Contributing to the Living Atlas is easy and open to all and additionally, can open your organization’s data to all. To get started, click here. From here, click the “My Contributions” tab where you will be presented with a tabular list of all your data, maps and apps. Now here’s where it gets really interesting. Esri provides a notification that indicates if you have items that may be eligible for inclusion in the Living Atlas.
Clicking on this notification will take you to a description and score of your item, in my case this is a web map application of best places to live in America. Additionally, suggested improvements are provided to make your data more likely to be accepted for inclusion. For example, a more detailed title or description may be suggested, or perhaps provide more tags and a more detailed description of you and/or your team.
Once you have stepped through the suggestions your item is ready for nomination – a minimum score of 80 is required. Note, many local organizations can also see the Community Maps program and include their data through that avenue. Click the “Nominate Now” button and you are done – good luck!

Geo Jobe Solutions + The Living Atlas
There’s definitely something useful in the Living Atlas for users of ArcGIS from any industry. Think of the Atlas as your partner in combination with the solutions that we provide here at GEO Jobe. Imagine this. Build your organization’s collection of available base maps, and professionally curated data which is all hosted in the cloud within the Living Atlas, then manage all your organization’s own data holding with clean my org, and use the industry-leading Admin Tools for ArcGIS Online to efficiently manage your users (and internal data, maps, and apps). Sounds like a winning combination of technology!
Suggested resources:
- Esri demographics data
- Living Atlas blog (Esri)
- Twitter – @livingAtlas
- The Living Atlas community on Geonet – contribute, ask questions, help, share.
- Highlights of ArcGIS Living Atlas Webinar
- Living Atlas on Geonet
Special thank you to Glenn Letham for writing this blog. Follow Glenn on Twitter at @gletham and make sure to visit his website!