


In November of 2021, Esri announced support for creating database connections to a variety of cloud data warehouses including Amazon Redshift, Google BigQuery, and Snowflake. These cloud data warehouses are designed to store large volumes of data and provide users with a highly scalable, performant data storage option that can be used in addition to the traditional RDBMS systems like Oracle, PostgreSQL, and SQL Server. Support for database connections to cloud data warehouses was first available in ArcGIS Pro 2.1 and ArcGIS Enterprise 10.9.1.
In this post I’m going to walk you through the process of ingesting a table with X,Y columns into Amazon Redshift, converting the table to a spatial table, and accessing the data in ArcGIS Pro.
I’m not going to cover the steps to create the Redshift cluster, but as prerequisites you’ll need the following:
- An Amazon Web Services Account
- An Amazon Redshift cluster that has been configured to be publicly accessible. For the purposes of this post, the clusters offered at the free tier will be sufficient.
- A data file (like a .csv) that contains X and Y columns.
To get started we’re going to need some data to ingest into the Redshift cluster. For this I’ll be using the 311 data from the Western Pennsylvania Regional Data Center. This dataset contains 311 service requests for the City of Pittsburgh that have been collected from the request intake software used at the city’s 311 Response Center. This dataset contains a variety of attribute columns including request types, request origins, neighborhood, and more, as well as X,Y columns and a description of the location accuracy (either exact or approximate). I downloaded this data in .csv format and uploaded it to an S3 bucket in my AWS account.
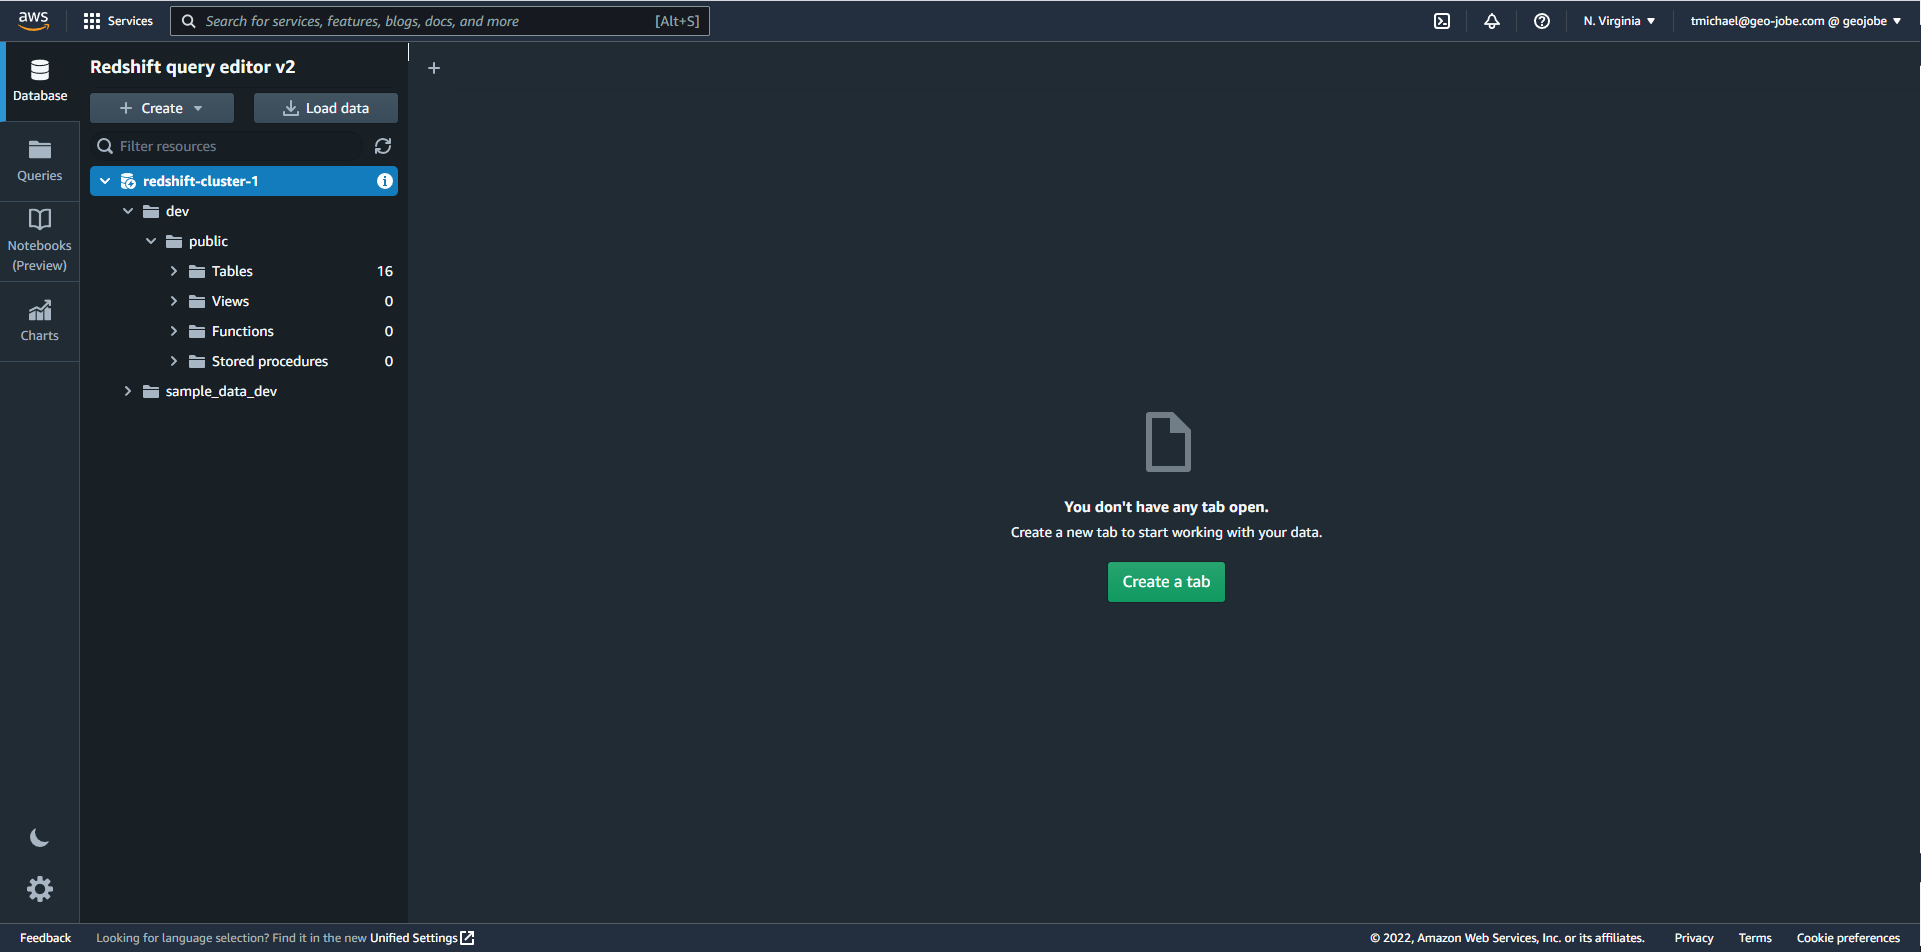
Once the file has been uploaded to Amazon S3 we can move over to the AWS Redshift console and open our cluster. We’ll be using Query Editor v2, which can be accessed from your cluster control panel by clicking Query data and choosing ‘Query in query editor v2.’ With the query editor open you’ll be able to explore data that is included with the cluster (in dev\public\tables) and create queries to load and explore datasets.
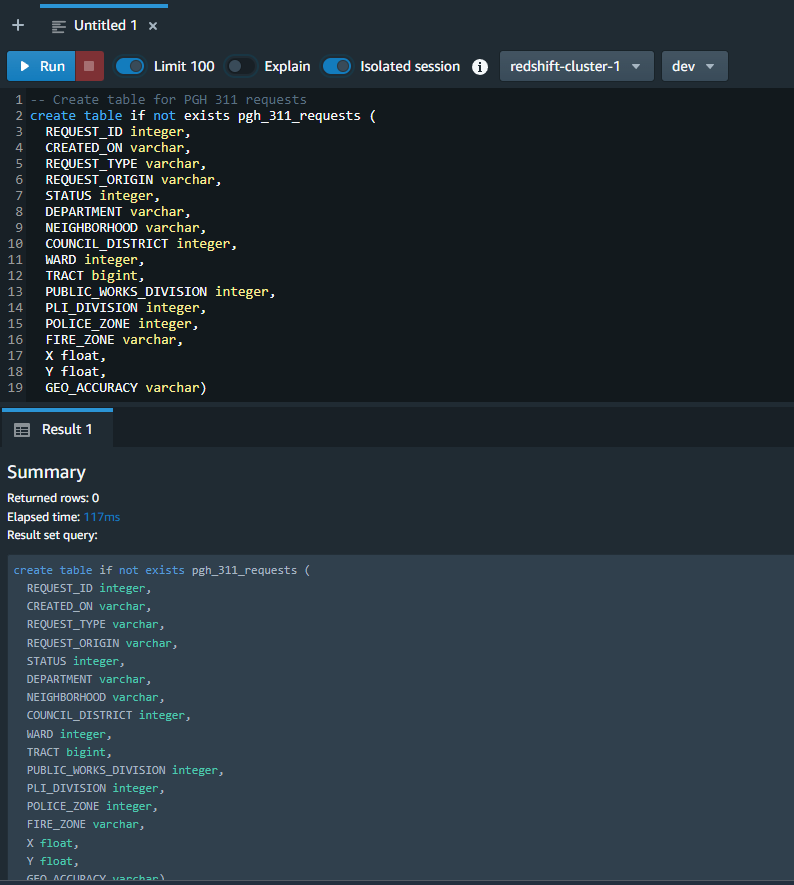
The first step in the import process will be to create a Redshift table that will store the imported data. We’ll use a query for this with a create_table command to define the columns and column types for the output table. While you can map fields during import in a later step I found it easier to include all of the fields in the input file in the schema of the output table, making sure that the field order matches the import file. If the query runs without error the new table should be available in the Tables directory of your cluster.
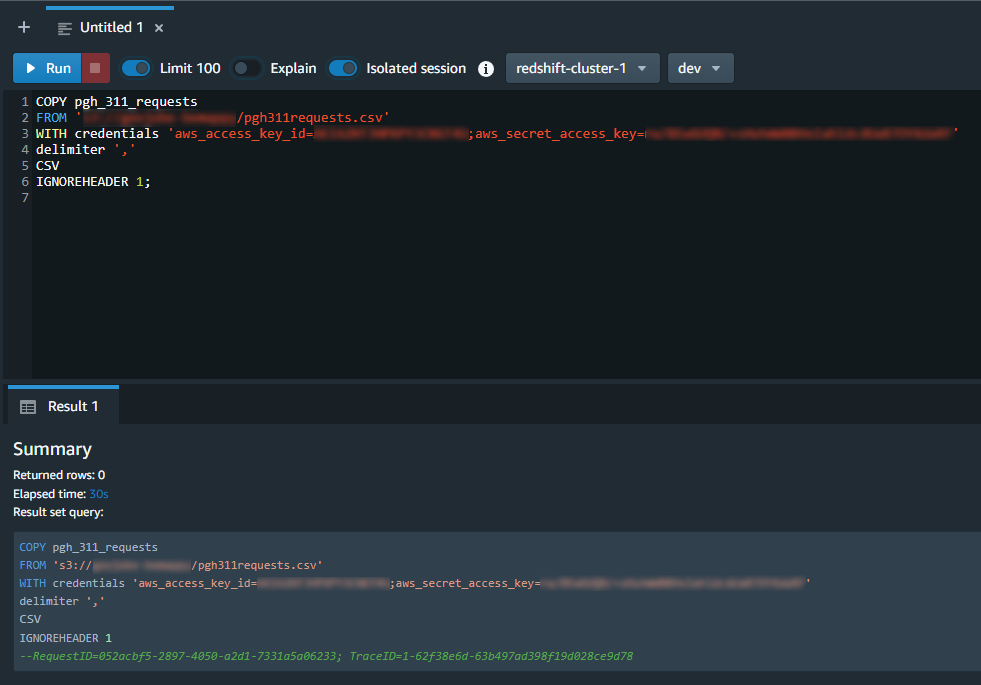
Next we’ll load the records from the .csv file that was uploaded to S3 into the table that we just created. For this we’ll use another query with the copy command. For this command the name of the table that you created in the previous step will be entered after the COPY command, and you’ll want to be sure that the path to the file and your AWS access key and secret access keys are correct.
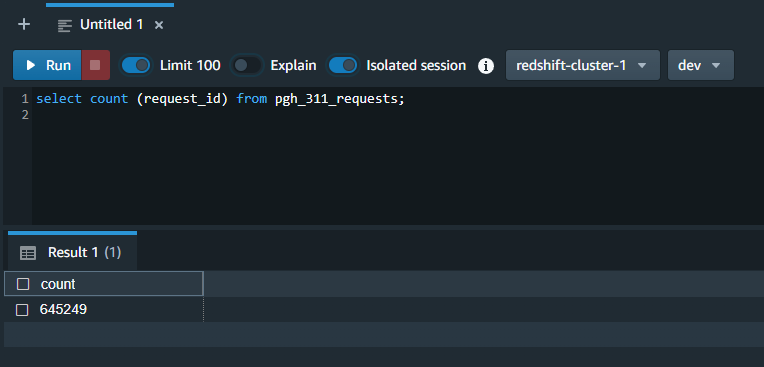
At this point I always like to do a “sanity check” to make sure that the data has been loaded into the table and that the attributes are in the correct columns. We can do this by querying the count of records in the database:
And by previewing a sample of the data:
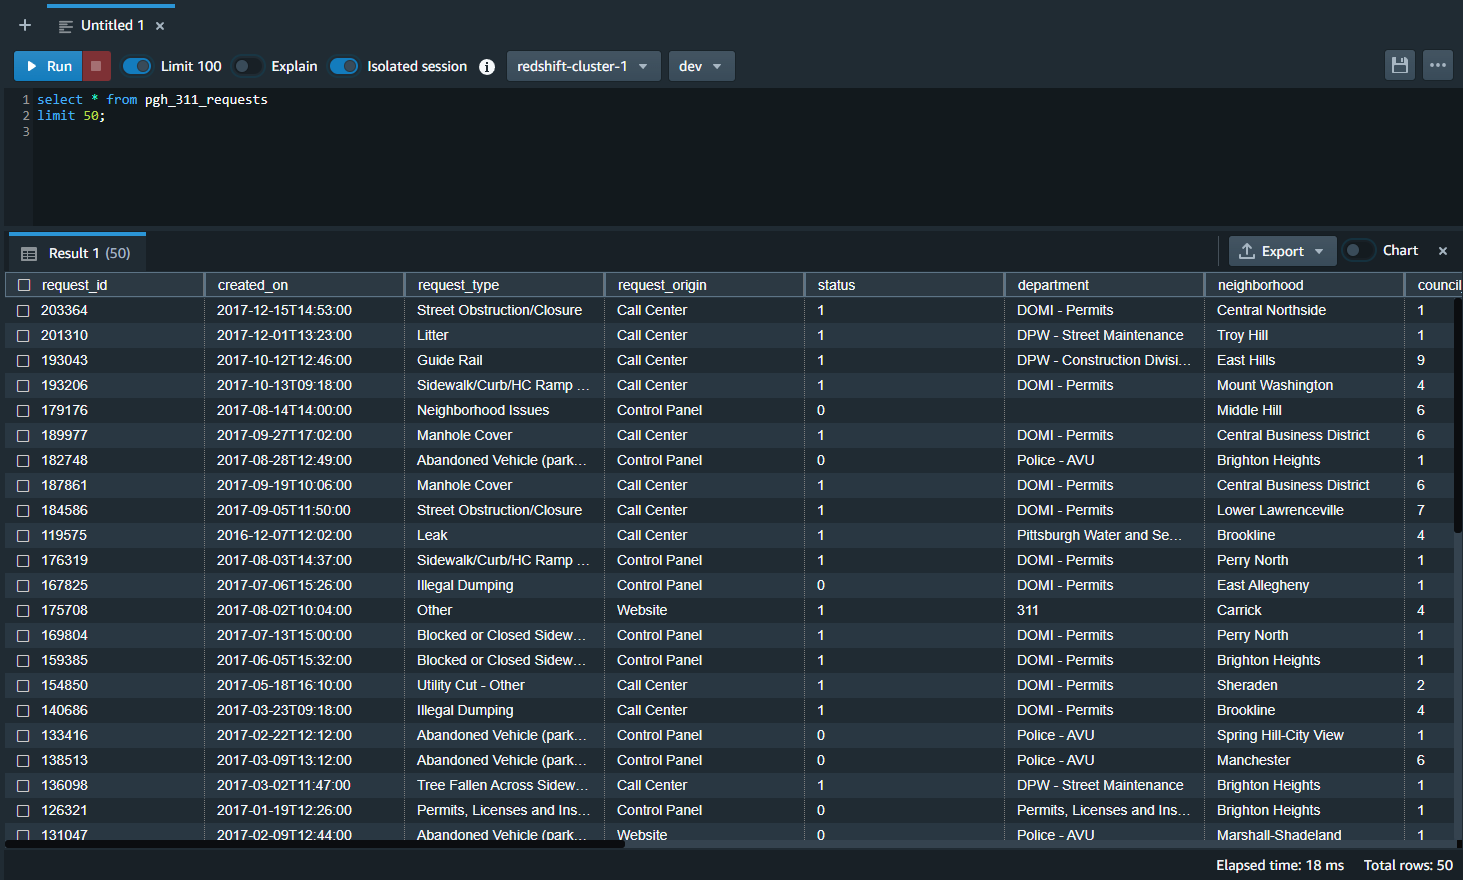
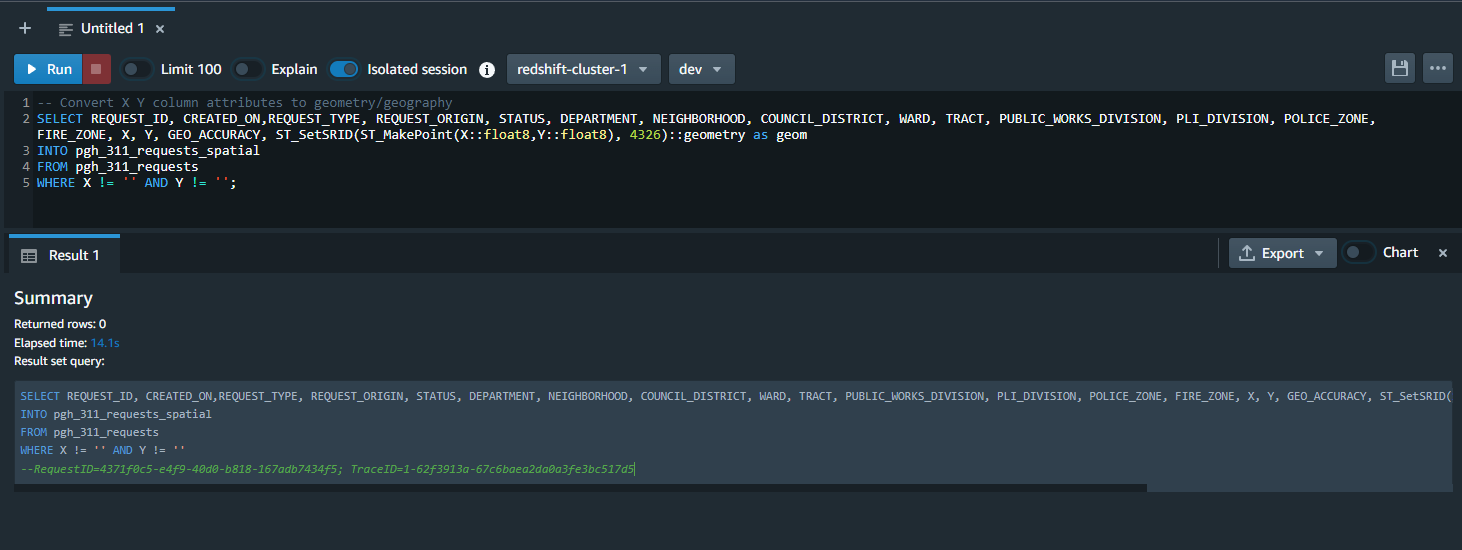
Assuming that everything looks good with the imported table we can now execute another query to create the spatial table. This query will make a new table with supported geometry based on the X,Y attribute columns. This query includes the ST_SetSRID and ST_MakePoint commands that convert the X, Y attributes into a point geometry for each row using a spatial reference system identifier (SRID).
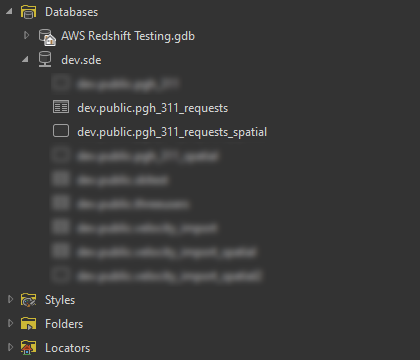
Once the table with geometries has been created from the imported data we’re ready to move into ArcGIS Pro to explore the data. Before making a database connection to Amazon Redshift, make sure you download and install the Amazon Redshift ODBC driver from AWS. Once that is complete you can open ArcGIS Pro and create a database connection to your Redshift cluster. Once created you should be able to view the tables that you’ve created up to this point.
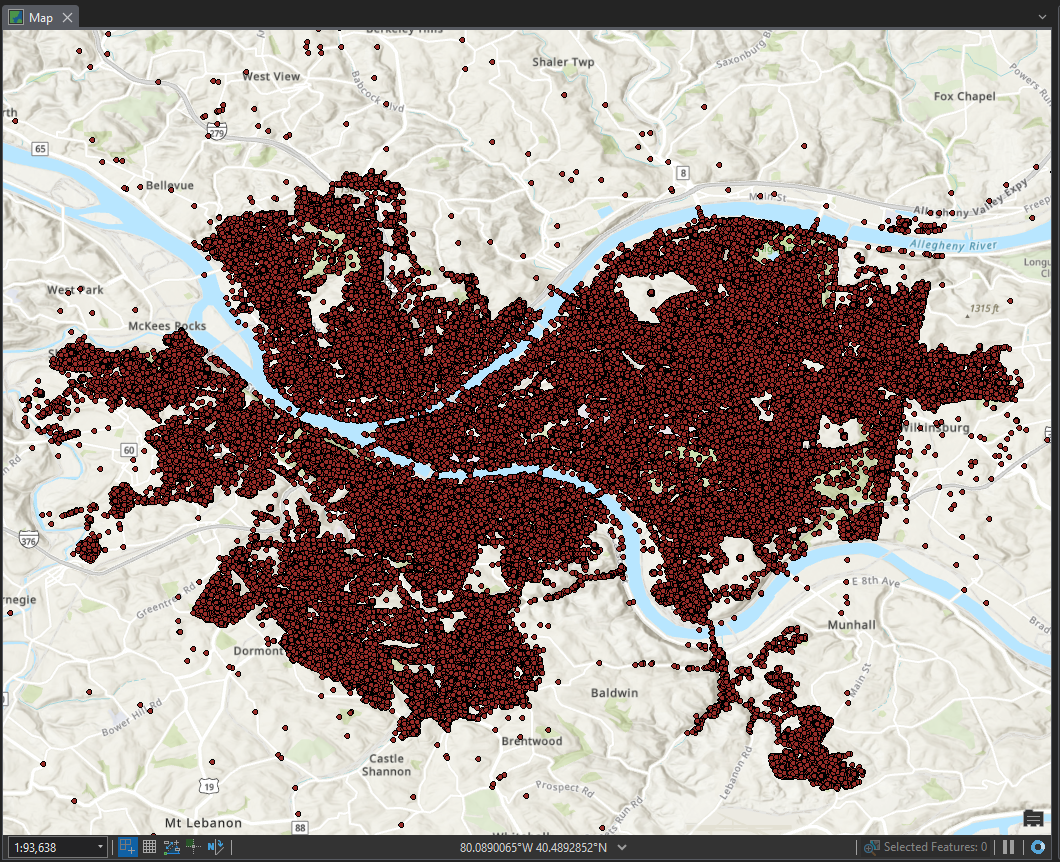
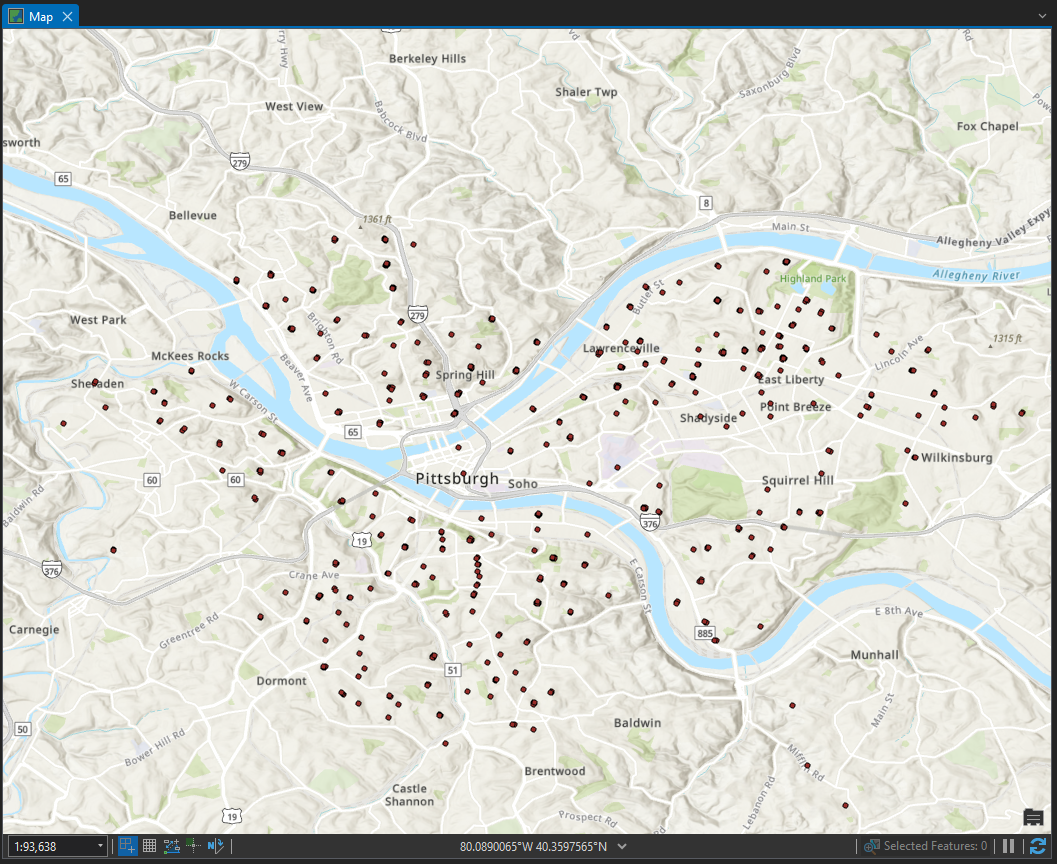
Now we’re ready to add the layer to a map in ArcGIS Pro. Once added, you can interact with the features much like you can with any other feature class; you can select, identify, define symbology, and create definition queries to view the features in different ways. Here is a view of the map with all features loaded:
And here is a view where I’ve applied a definition query to show only the 311 requests for Abandoned Vehicles:
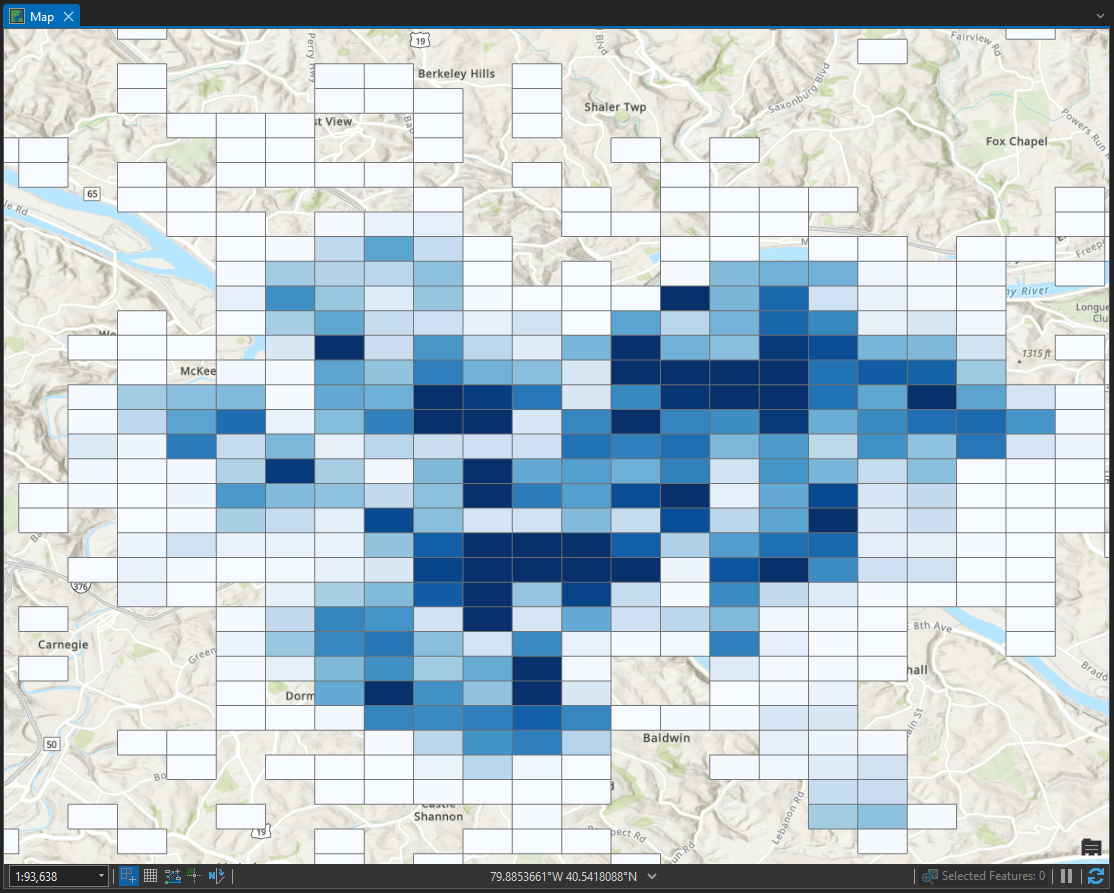
Another capability of working with data from a cloud data warehouse is the ability to Enable Feature Binning on the dataset to provide additional ways to view the data. Enabling feature binning on the dataset will provide a view of the data with discrete point features aggregated into bins which can help to visualize a complex dataset that contains a large number of features. While enabling feature binning you can also configure summary statistics that will be calculated for each bin for certain attribute types.
Beyond these initial capabilities it’s also possible to create query layers, create materialized views, and share the data as a map image layer through your ArcGIS Enterprise. The option to share data through your enterprise portal is especially powerful as it can help you expose large, complex datasets to your organization for visualization and inclusion in maps, applications, and dashboards that are shared across the organization.
I hope you’ll try these steps with a dataset of your own and start exploring the capabilities of using a cloud data warehouse as part of your organization’s data storage strategies.
If you want to learn more or need help deploying cloud data warehouse storage, please reach out at connect@geo-jobe.com.
Resources
GitHub Gist – SQL queries from this post
Amazon Redshift tutorial – Loading data from Amazon S3
AWS Partner Network Blog – Leveraging the Power of Esri’s ArcGIS Enterprise Through Amazon Redshift