


The Map Series, in my opinion, is one of the most underrated tools in ArcGIS Pro. It is a fantastic way to customize reports that summarize data within a polygon layer. The ability to use queries and dynamic text that provide answers to the questions being asked for multiple areas of interest is a breeze.
Map Series
For those not familiar with a spatial map series, it is essentially a layout that is applied to each feature of a polygon layer, also known as the Index Layer. Try thinking of it like counties in a state or sample locations in a study area. You can configure the layout to include any number of elements to display the information in question in a visually appealing manner. Esri provides great documentation on how to configure a map series. So I will explain how to apply a definition query to each page of the series. This is something you will need to do if you want to filter your data by attribute and location, as opposed to one or the other.
For example, if you work in disaster management and want to check the status of assets in each county after a storm, you can configure a dynamic text box, so as you click through the counties, the number of repaired assets will update to show only the ones in your area of interest.
Configuring Your Map Series
Once the map you want to use is in the layout, you will add a new layout to the project. Add the map to the page, but make sure to leave room for text boxes. On the Format tab, click the dropdown arrow on the Dynamic Text button. There, you will see several different dynamic text options. In this case, the one we are looking for is Count, which is located in the Table Statistics section.

You will then be prompted to configure the text box. The sources will be populated automatically, so only change them if you need a different table or map frame. This is where the query configuration begins.
Custom Query
From the Query dropdown menu, select Custom Query. For this example, let’s say we are looking for features where the outage status is “restored”. Set your query, click OK, and draw your dynamic text box on the layout.

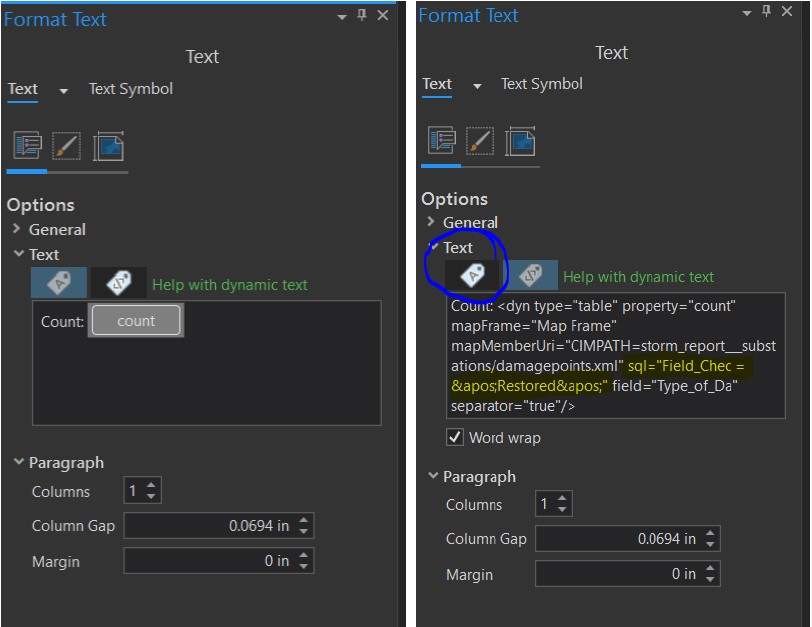
You should now see the number of restored assets in the entire feature class printed in the text box. This is a good start, but not what we are going for. With the dynamic text box selected in the layout, you will see a Format Text pane. By default, the Text view is selected (under Options > Text), but we will change it to the Tags view so we can pull in the SQL query for our next step. In the photo below on the right, the text that you will copy is highlighted. Copy the query from that box and then toggle back to the Text view (see photo on the left for reference). Then click the “count” button to re-open the initial configuration window (pictured above).
With the Insert Table Statistic window now open, change the query setting back to All Rows and click OK. Now, on the Format Text pane, open the Text view again and paste the SQL query you copied in the last step right between the “mapMemberUri=xyz.xml” and “isDynamic=’true'” segments. Your text box will now display the accurate count of assets as you change pages in your map series!
That’s a Wrap!
My favorite part of using a map series is the creative freedom it allows. Seeing the report change in real-time as you make updates is also important, and being able to do this in ArcGIS Pro may even eliminate a company’s need for external reporting software. If you need assistance creating a report with a map series in ArcGIS Pro, don’t hesitate to reach out to our team via e-mail! We would love to talk with you!