
Network Tab Basics
The network tab of the dev tools is extremely useful when you want to know what information your browser is sending out and receiving.
In the network tab you can see exactly what URLs requests are being sent to, the current status of each request, the response types of those requests, where in the code those requests are being made from, the file size of the responses, the time each request took to finish, and finally a breakdown of how long each portion of the request took.
Icons beside the URL in the name column indicate the type of request, and the name itself will turn red if the request fails, allowing you to quickly identify problems. At the bottom of the table, you can see the total number of requests made and the amount of data transferred.
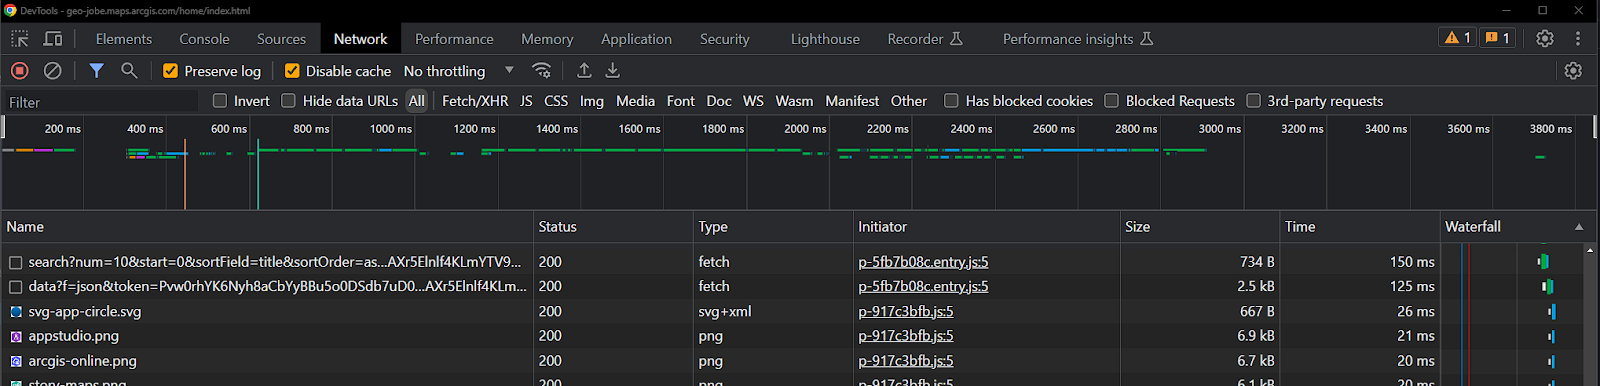
The network tab
You can also click on the name column of any request, and the dev tools will show you a detailed breakdown of that request and its response. This can be useful when you want to see exactly what information is being sent with the request, or you want to view exactly what information is being included in the response.
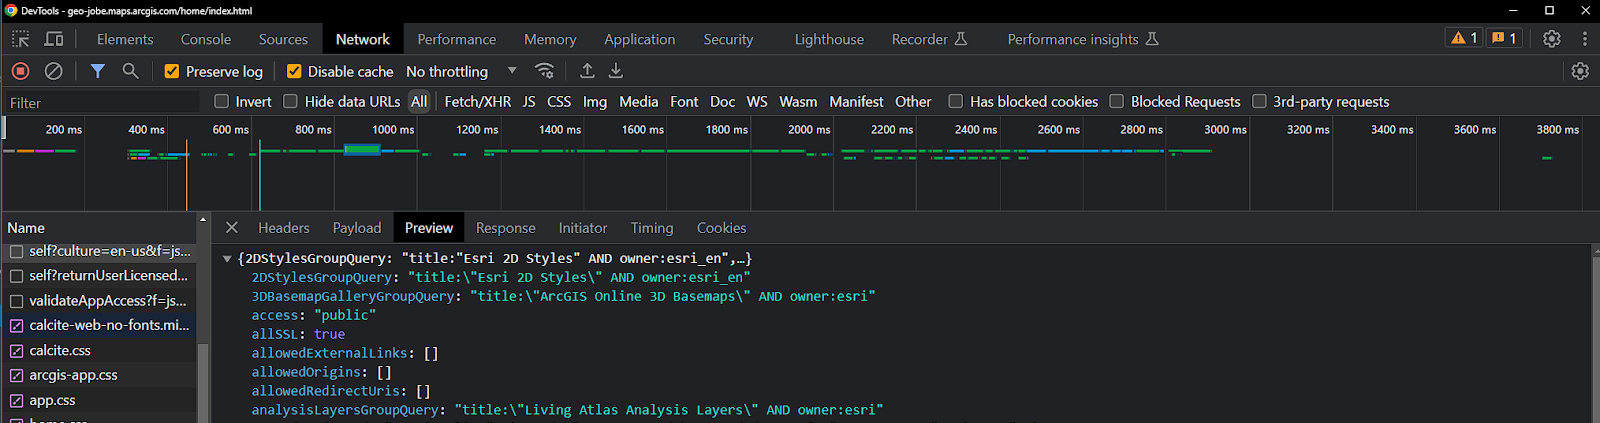
The response tab for an individual network call, selected on the left
Network Tab Tools
There are also a number of useful tools for filtering and modifying the performance of the network tab located near the top of the page.
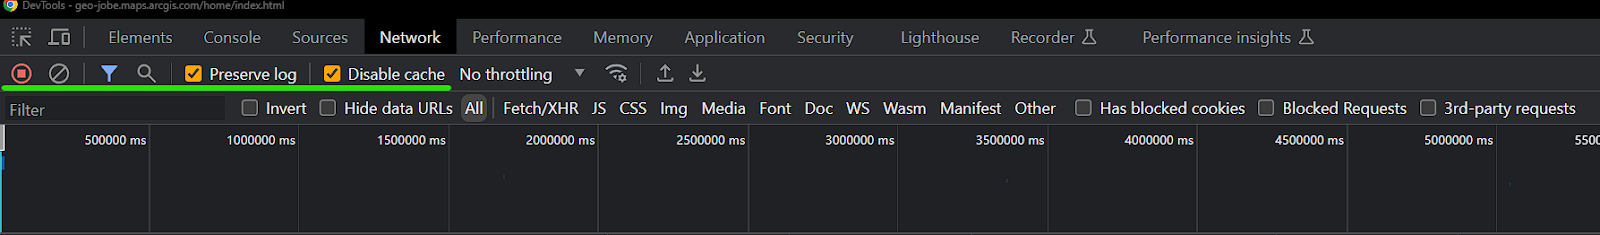
Tools for managing how calls are tracked and displayed in the network tab
Starting on the left, we have the start/stop recording network log button, which is useful if you only want to record network traffic over a known period of time, for example after clicking a submit button, until you get a notification of success.
After that is the clear logs button, which will remove all records from the network tab. This is useful when on a page that makes a lot of requests when the page loads, but you only care about later requests. Next is the Filter option, which gives you many different options for filtering requests.
You can filter requests by URL, invert that filter to exclude requests that match that filter, hide data URL, filter requests by response type, filter by whether the request has blocked cookies, filter for blocked requests, and finally filter by 3rd-party requests (requests to content outside the domain of the web page you are on).
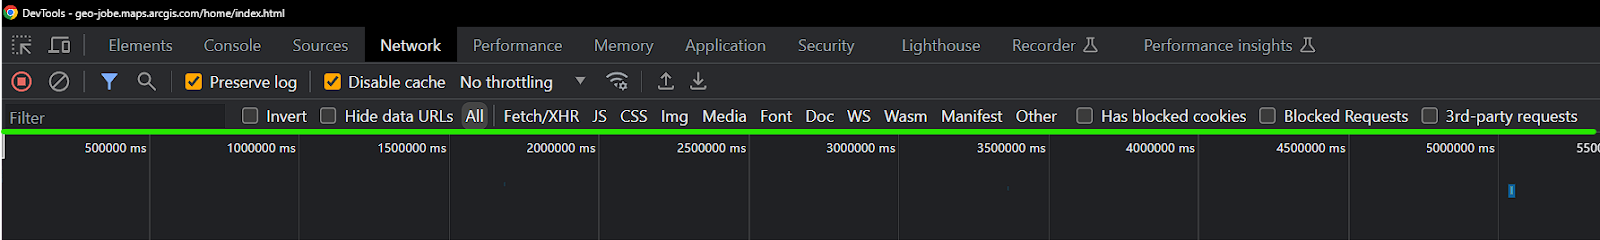
Filtering option for network calls
After request filtering, you have the search option. This allows you to search any field of a request or response for specific text or a regular expression. This can be extremely useful when you know some information from a request or a response, for example a username, and you want to know what requests contain that information somewhere within them.
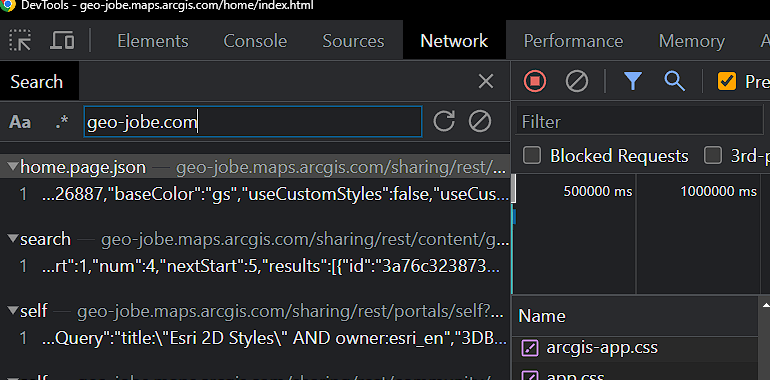
Filtering network calls by text
Following the search button is the preserve log toggle, which preserves the log when navigating to different pages or refreshing the page, and the disable cache toggle which forces the browser to fetch new data when reloading, instead of relying on cached data. After that are network throttling features, which can be useful for developers when simulating poor internet connections.
Finally, another very useful aspect of the network tab is the export / import HAR functionality.The export functionality allows a user to export a file containing all of the logs currently in the network tab, and either save it for a later date or send it to a developer or IT professional for them to read.The import functionality loads a HAR file created by exporting, allowing you to see the network traffic captured by that export.
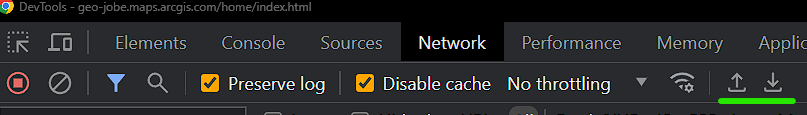
The buttons to import and export a HAR file
The network tab is very useful for debugging. If something isn’t working properly in an application, the network tab can show whether requests to certain resources are failing, whether an error message is being returned, or whether the wrong parameters are being sent in. There are a couple of important caveats about the network tab.
First, unlike the console, which will always record information, the network tab will only record information if the dev tools window is open. If you perform an operation and afterward want to see what requests were sent, you will need to open the dev tools and then perform the operation again.
Additionally, the network tab only shows requests that are sent client side. If an application is sending requests from the server side, they will not appear in the network tab (however the network tab will show calls from the client to the server).
In Conclusion
The network tab is an important tool for understanding your application’s functionality, diagnosing problems, and gathering information to send to tech support. It’s also just one of the tools available in the dev tools.
If you haven’t already, check out our articles on the other tabs, listed below. And if you want help using the dev tools to manage your ArcGIS environment, or if you have any other geospatial questions, feel free to reach out to connect@geo-jobe.com and our team of expert developers will be happy to assist you.
Want more? Check out these other articles from our MapThis! blog:
- Dive Into Dev Tools
- Dive Into Dev Tools, Part 2: Elements
- Dive Into Dev Tools, Part 3: Console and Sources
- Crisis to Coordination: How Local Governments Harness GIS
- Scheduler for ArcGIS: Automating Admin Tasks in ArcGIS

About Our Company
GEO Jobe is a leading GIS software and geospatial solutions provider, serving over 10,000 organizations globally. GEO Jobe is best known for developing the most popular applications in the ArcGIS Marketplace, including Admin Tools for ArcGIS, Backup My Org, Clean My Org and Scheduler for ArcGIS.
GEO Jobe offers U.S.-based 24/7 Support solutions for organizations using Esri’s ArcGIS© System. GEO Jobe also offers professional services focused on Esri’s ArcGIS© System, including custom software development, enterprise solution implementation, data science and UAV data collection.
Founded in 1999, GEO Jobe is in its 25th year of operation, has been an Esri business partner since 2002 and is currently a Platinum Partner.
To learn about our variety of GIS products and services and how we could benefit your organization, email GEO Jobe at connect@geo-jobe.com.