


Coming back to the Dive Into Dev Tools series, we previously introduced what Chrome DevTools is and its importance in the development stage of web applications. It can arguably prove to be a web developer’s strongest asset in inspecting, debugging, and optimizing a web application’s aesthetics and performance.
In part two of our series, we also dove further into understanding the Elements tab and its uses. In this article, we will continue to explore Chrome DevTools’ other features and see how they can be utilized to enhance webpages and applications.
Console Tab
To the average user, the Console tab is potentially the most used feature in the Dev Tools collection. It gives the user the ability to display errors, warnings, and debugging logs in a visually organized, color-coded list directly on the browser page..
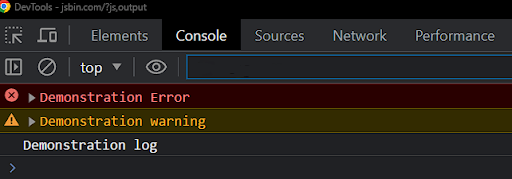
Example 1.1: Log notes are color-coded to specify result type
This can be used as a validation check to diagnose errors, read debugging messages programmed by the developer, and check the order of logged occurrences. The log notes can be filtered, both by text search or by log type, as shown in the example 1.2.
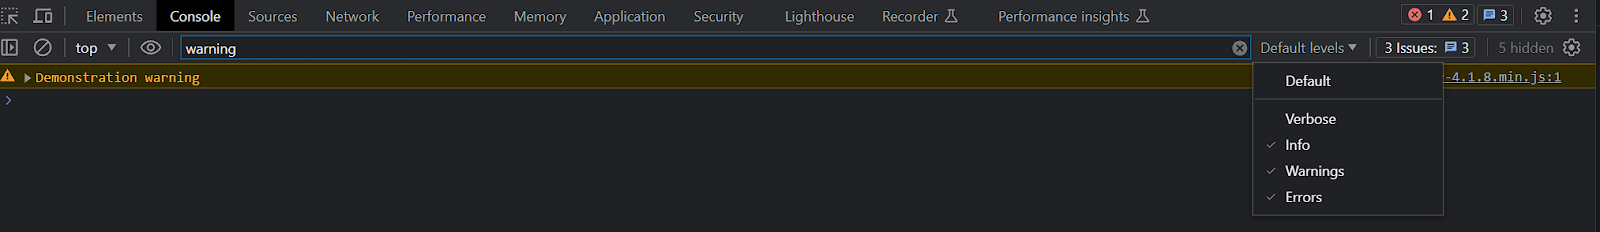
Example 1.2a: Filtering log by text search
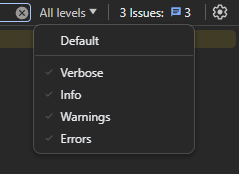
Example 1.2b: Filtering log by type using dropdown options
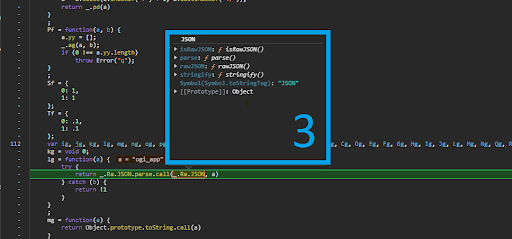
The Console tab can also be used to execute code inside the browser (Example 1.3). This should only be implemented when the code is understood, as executing code from a non-trusted source can prove to be a security risk. When properly utilized, the console log can be an effective tool in debugging browsing content.
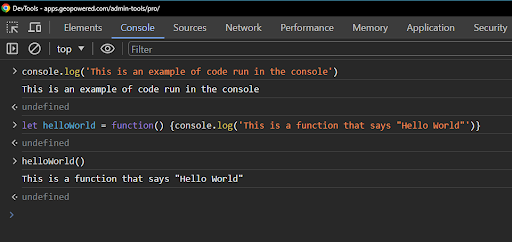
Example 1.3: Executing code inside of the console tab’s log
Sources Tab
We learned in part two that a user has the ability to edit a webpage’s rendering when pertaining to HTML and CSS. Well, what if a user wants to view and edit the way webpages run? This is where Dev Tools’ Sources tab comes in handy, which allows a user to debug JavaScript code with important features, such as breakpoints and debuggers.
A breakpoint is a stopper that pauses code execution. The alternative option to this is typing the keyword debugger inside of the code execution, which will generate the same outcome as a breakpoint. Think of these stoppers as checkpoints that will help to inspect how code is executed and how data is being transferred. These features are utilized to help better address program execution and ensure that values are properly set.
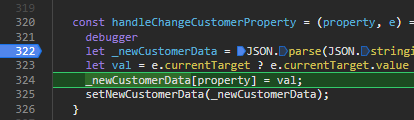
Example 2.1: Breakpoints (line 322 highlighted in blue) and debuggers (line 321) are placed on lines of code set by the user
The Sources tab contains different panels that help diagnose a webpage’s interactive debugging process. In example 2.2, the left sided panel (section 1 – blue outline) highlights how the file directory is arranged and allows for easy navigation between scripts. The middle panel (section 2 – green outline) is where the code execution takes place.
The browser will highlight a specific line, which displays the current process and location of where the code execution falls in. The right panel (section 3 – highlighted in orange) contains multiple panes that assist with the debugging process and expand code execution into further details. These include:
- Breakpoints pane: Identifies specific breakpoints on designated lines of code. Users can toggle the exceptions checkboxes (located by scrolling to the top pane) where an exception or an error is set to occur.
- Scope pane: Identifies property values and variables in local, closure, and global scopes.
- Call Stack pane: Look at the path the code took to get to its current location.
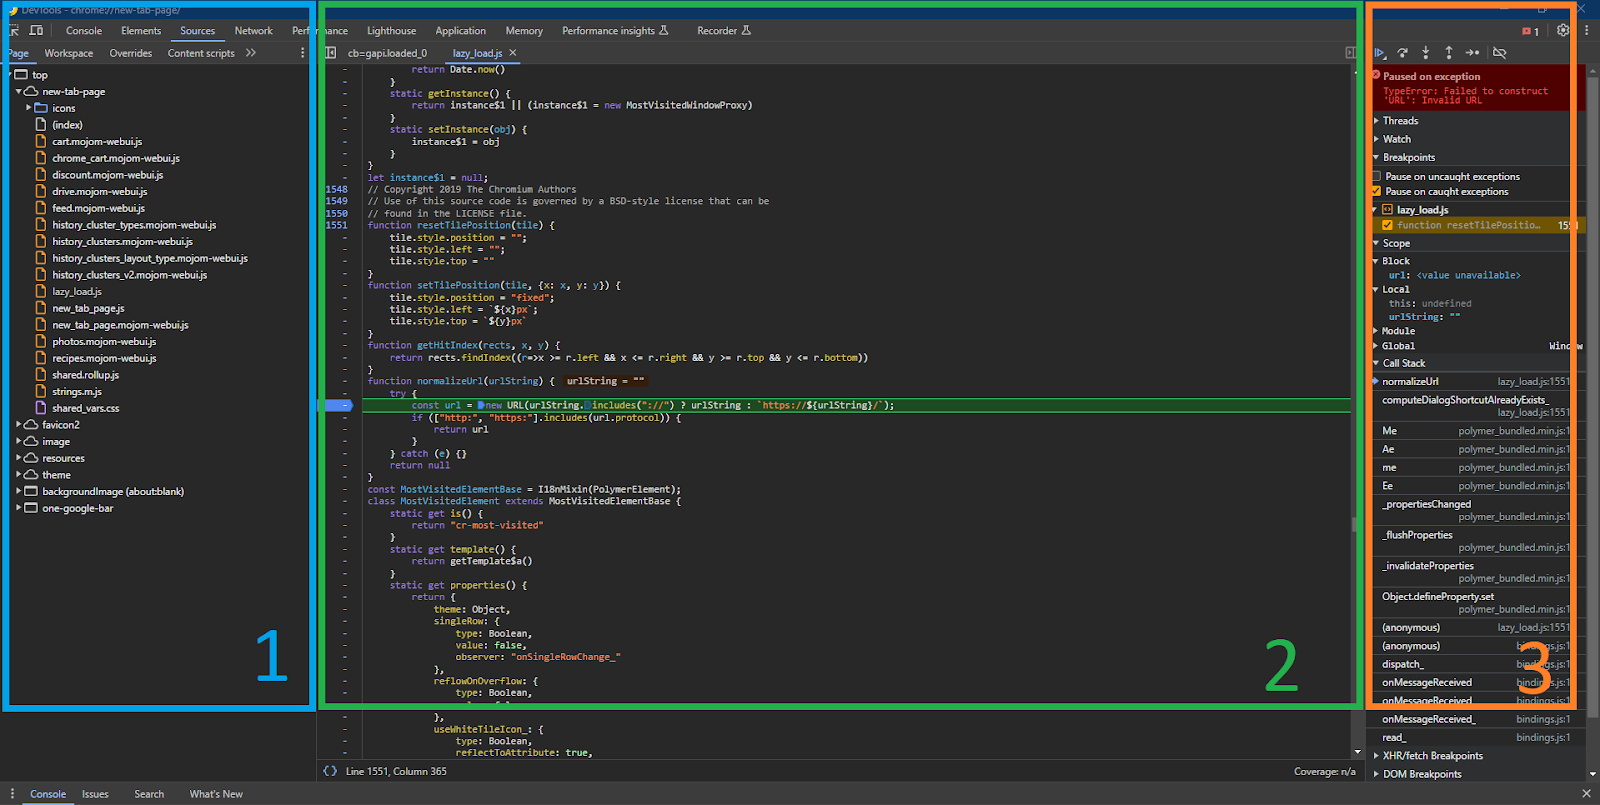
Example 2.2: 1. Panels for source directory, 2. code execution, 3. Additional source panels
Another key feature in Sources is its ability to inspect content values. Once the execution has been paused by breakpoint or debugger, hovering the cursor over a variable in the code will display its containing values. Another option is to look over to the right panel’s scope section where the result values will be shown after it has been read and accounted for or what is called “stepping through”. “Stepping through” lines of code will create a snapshot of the content values next to that line of code.
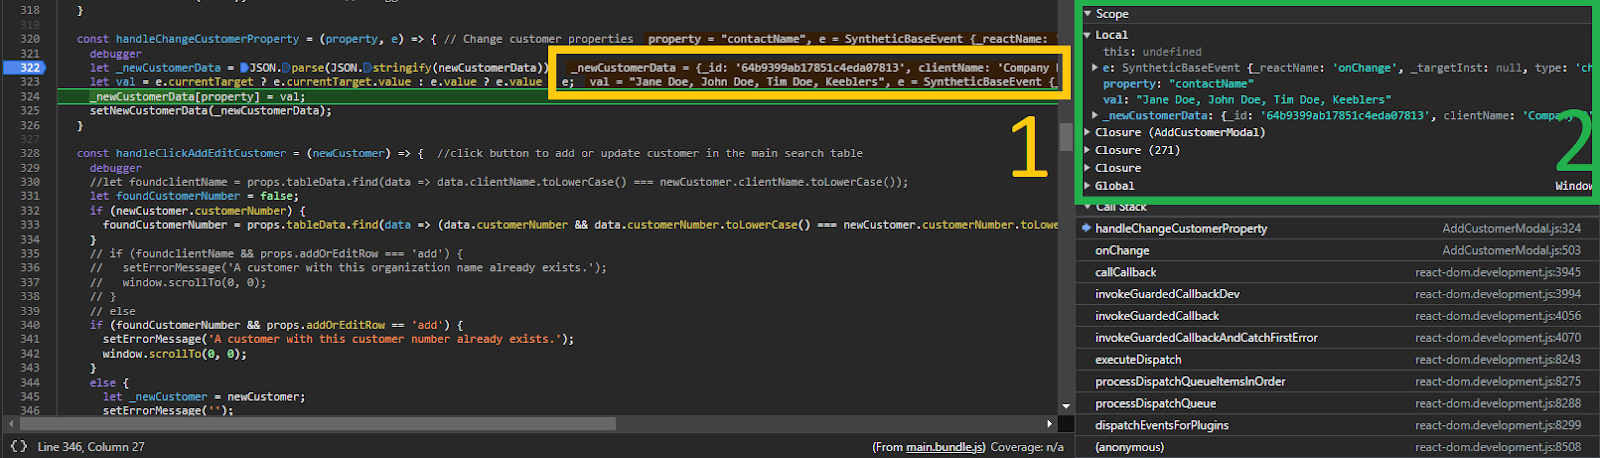
Example 2.3: 1. Highlight values once stepped through, 2.Provides scoping details of value, 3. Hovering over a variable will display its containing values
The “stepping through” process comes with a set of tools that handles different ways to navigate through the code execution. In example 2.4 below, a small row of icons can be found above the right panel of the Sources tab. The first icon is simply responsible for pausing and resuming code execution, either until the process ends or upon reaching the next breakpoint/debugger.
When paused on a specific line of code, a user can select the second icon, or step over, to execute through the function call and return to the next line after the initial call. This is used when delving into the details of a function call is not necessary. The third icon, or downwards arrow icon, enables the user to step into the function call if a user needs to further inspect its content.
Alternatively, the user can use the fourth icon, or upwards arrow, to step out of the current function call. The step out of the tool essentially finishes the rest of the code execution within that function and returns the user to the placement of where the function call was initiated. The right arrow icon, or step, simply points to the next line of code without any skips. The very last icon toggles all breakpoints on or off during the step through process.
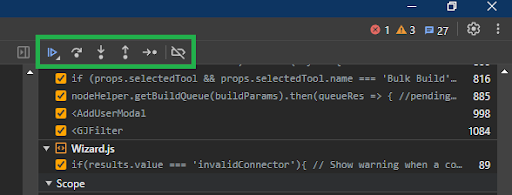
Example 2.4: Toolset to navigate the “stepping through” process; Hotkeys from left to right: Pause/Resume ‘F8’, Step Over ‘F10’, Step In ‘F11’, Step Out ‘Shift + F11’, Step ‘F9’, Activate/Deactivate Breakpoints ‘Ctrl + F8’
In Summary
As we wrap up this portion of Dive Into Dev Tools, we now have a more comprehensive understanding of what the Console and Sources tabs include and how they can be utilized. In the final part of this series, we will examine and detail the Network tab in Chrome DevTools.
For further questions, feel free to reach out to connect@geo-jobe.com and our team of expert developers will assist. Until then, Happy Coding!